

![The 5 Most Important Features of Google Analytics [Beginner's Guide]](https://mdvirtue.com/wp-content/uploads/2020/10/The-5-Most-Important-Features-of-Google-Analytics-Beginners-Guide.jpg "The 5 Most Important Features of Google Analytics [Beginner’s Guide]")
If you have a website, you need Google Analytics. It just might be the most useful free tool that a company has ever made widely available to businesses.
Every website is created with certain goals in mind. This is true even if you didn’t take the time to sit down and define those specific goals (which is a step worth taking, by the way). If you have a business website, you want the site to help you sell something. If you have a media site, you want to provide articles that inform and entertain a large number of people. No matter your website, you want it to do something.
Google Analytics is crucial because it enables you to track how well your website accomplishes its goals. It offers a relatively easy way to figure out how people are finding and interacting with your website – or if they’re not doing either, as the case may be.
If you do any marketing for your website, Google Analytics will help you track what’s working so you can make sure the time and money you spend is paying off. And if your website isn’t getting the kind of traction and interest you were hoping for, it allows you to recognize that sooner versus later so you can step up your efforts or change your approach.
Knowing you should use Google Analytics is one thing, but once you have it set up, what’s next?
This guide will walk you through five of the most important types of data Google Analytics provides and how you can put it to use.
5 Important Data You’ll Find in Google Analytics
If you’re new to using Google Analytics, understand that you won’t see a lot of data immediately – it doesn’t work retroactively to show you past analytics. But with time, you’ll have access to all the valuable analytics described here.
1. How Many People Visit Your Website
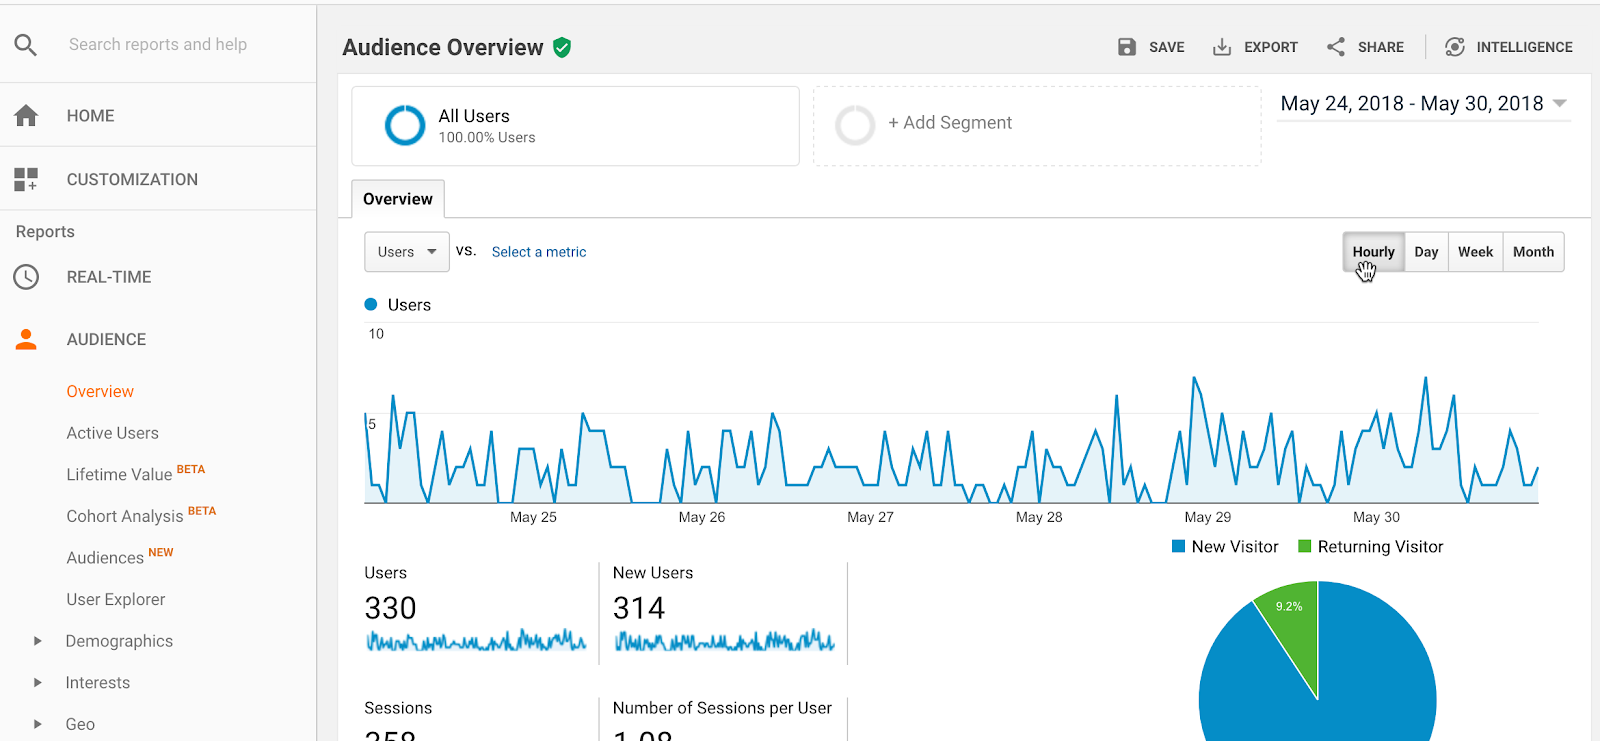
One of the most important metrics of website success is whether or not anyone is finding your website to begin with. Every other goal you want to accomplish with your website depends on people actually visiting it. That’s why Google Analytics puts traffic data front and center when you log in.
Number of Visitors
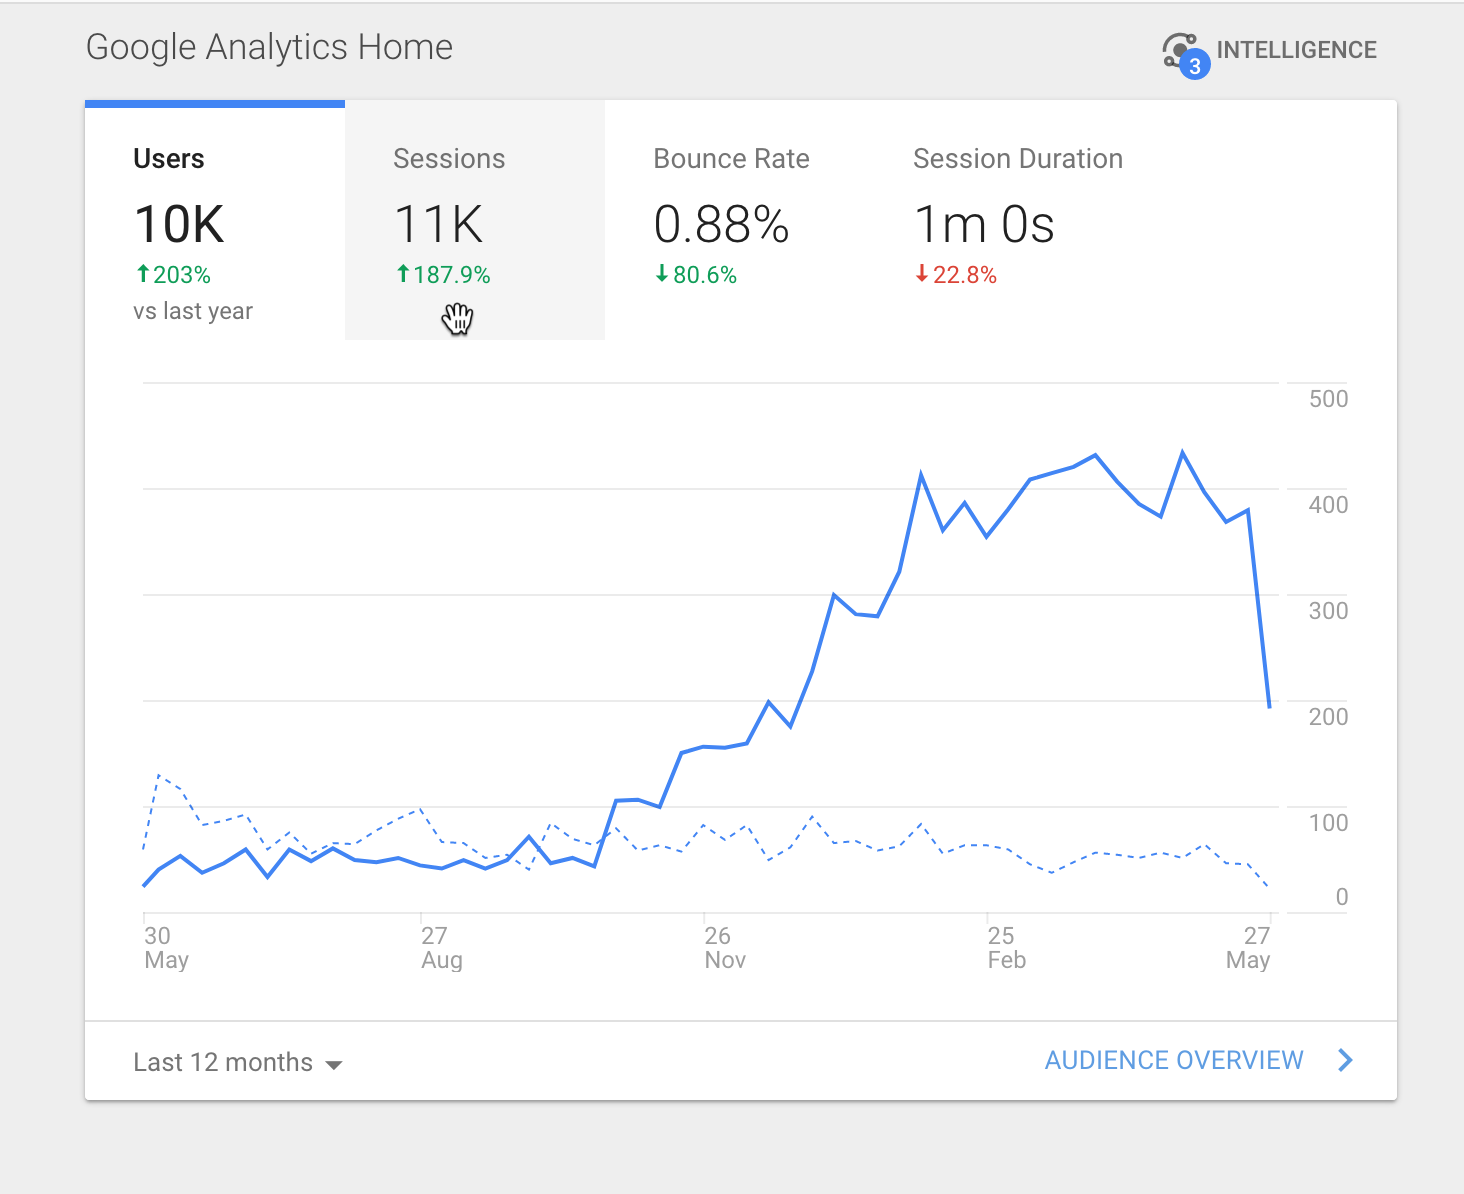
In the main dashboard of Google Analytics, you’ll see Users in the top right corner. This is the number of unique visitors that have come to your website in a set amount of time (Google Analytics defaults to showing the past seven days).
Number of Visits
Just to the right of Users, you’ll see Sessions, which tells you the number of unique visits to your website in a set time frame. This number will typically be different than the number of visitors because some the people who come to your website will visit more than once.
That means that having a lower number of users than sessions is a good thing – it means people like what they see enough to come spend more time on your website.
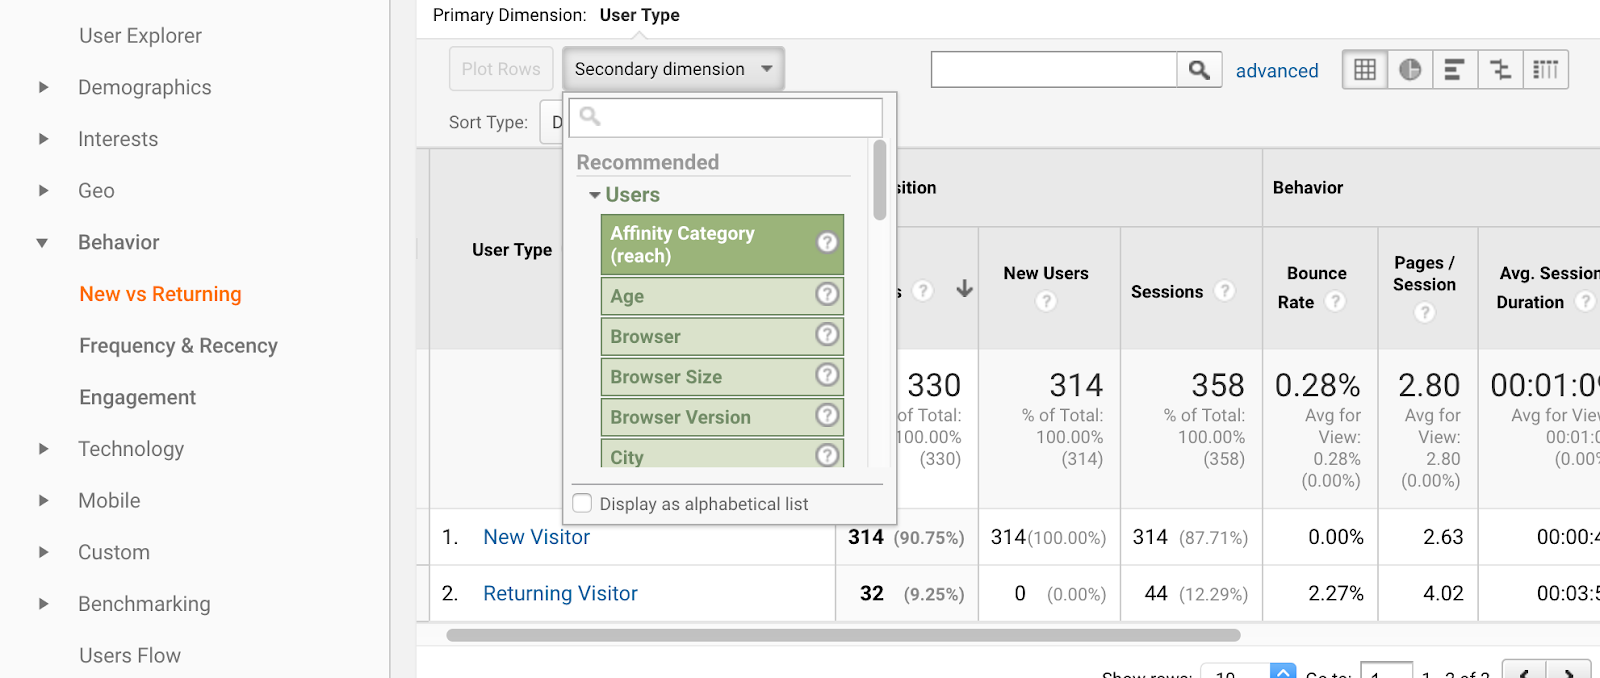
If you don’t feel like doing the math to figure out how many of your visitors are repeat visitors, or you want to see data specific to each type of visitor, click on Behavior in the Audience menu, then select New vs Returning. On this page, you can see the breakdown of how much of your traffic came from first-time visitors versus repeat visitors.
You can also use this page to analyze how different metrics break down between the two types of visitors by using the Secondary Dimension dropdown menu. As a note, the Secondary Dimension menu is available for many of the different categories we’ll be covering here if you want to slice and dice your data using the categories provided.
Visits by Page
Different pages on your website will be more popular than others. Knowing which pages people visit the most frequently helps you understand which topics you cover, or which products you sell, are bringing you the most attention.
To see your traffic breakdown by page, look for the Site Content section under the Behavior menu. Once there, click on All Pages.
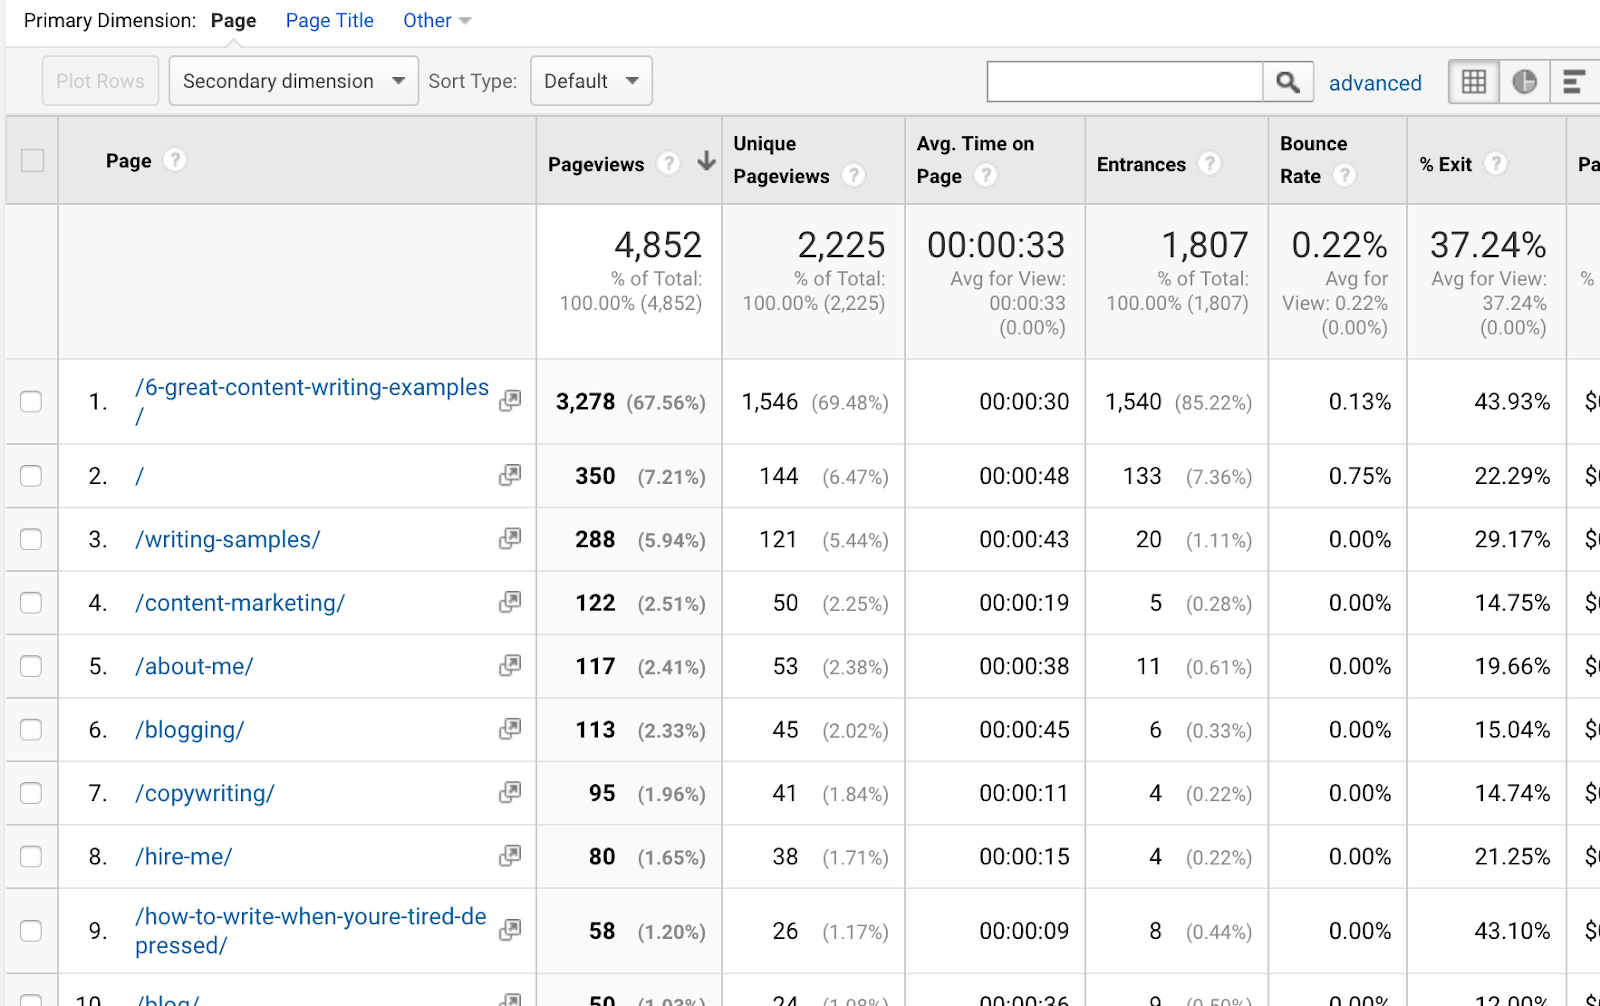
Google Analytics will show you the list of pages on your website in descending order of popularity, with your most visited pages at the top.
Visits by Date
Google Analytics helps you understand what’s happening with your website traffic. Perhaps more importantly, it also helps you figure out why.
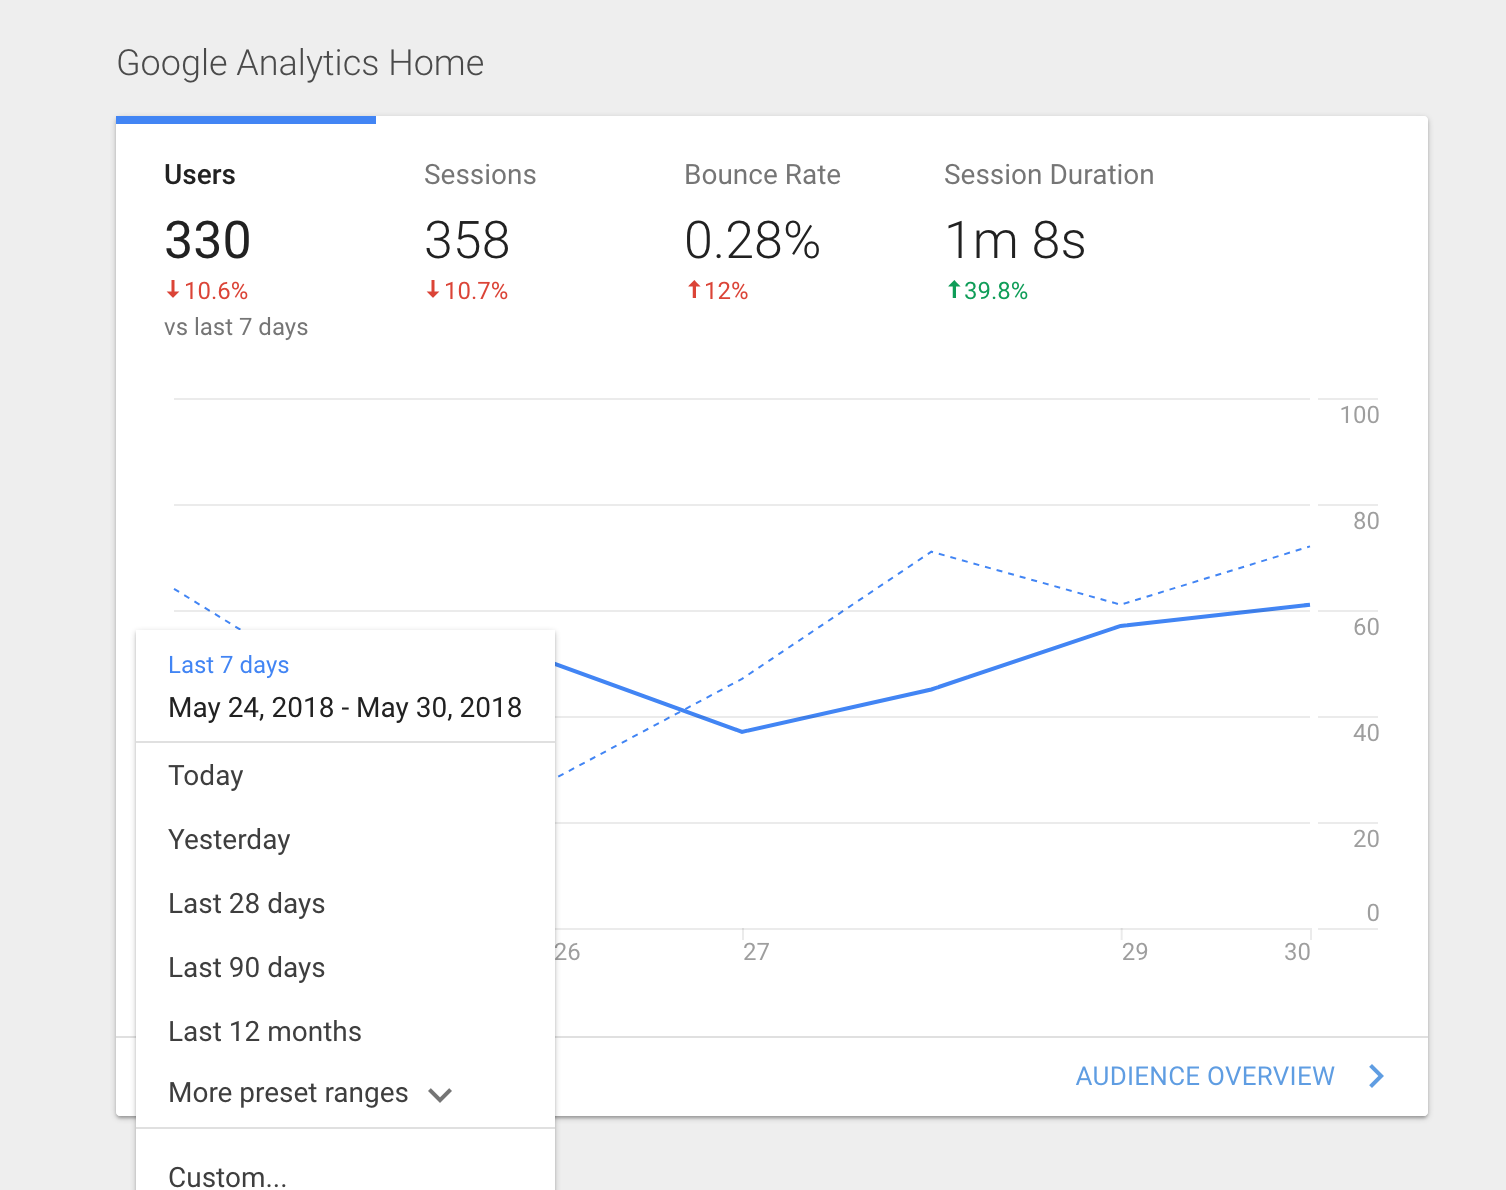
On the main dashboard, Google Analytics allows you to see how your traffic breaks down by date. You can change the date range you view by clicking on the menu in the bottom left corner (when set to the default view, look for where it says Last 7 Days).
With this feature, you can see how traffic trends for your website change over time, or you can hone in to spot specific days, weeks, or months that got an unusually large amount of traffic.
Visits by Hour
Altering the date range allows you to pull back and see larger trends in your traffic data, but you can also zoom in for the same purpose. You can see the breakdown of traffic on an hour-by-hour basis by clicking Overview in the Audience menu and choosing hourly. This reveals trends in the times of day people visit your website.
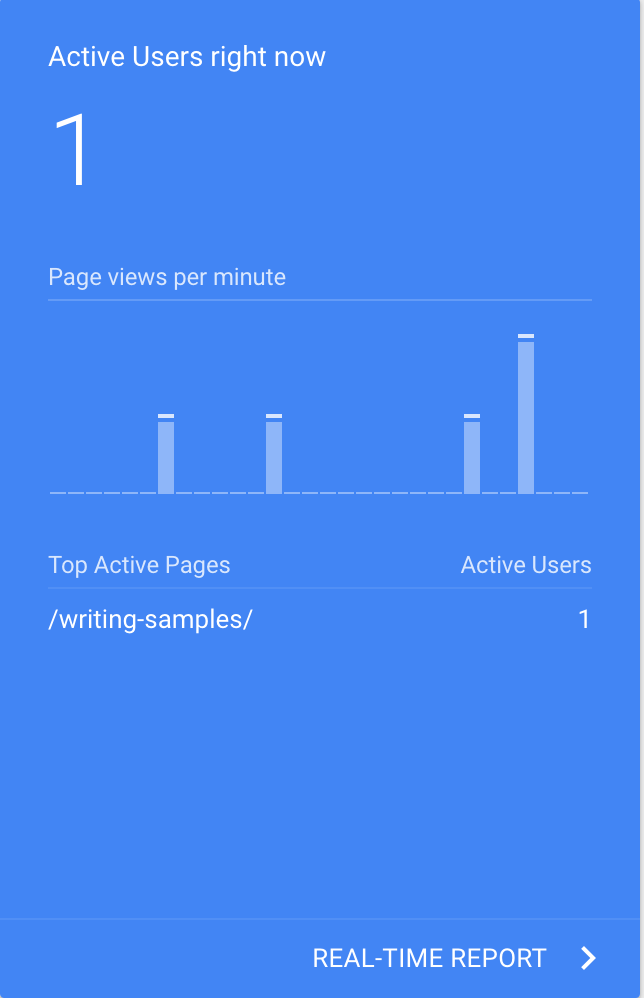
Back on the main dashboard, if you scroll below the top graph, you can even see how many people are on your website at the moment you’re exploring Google Analytics.
2. How People Find Your Website
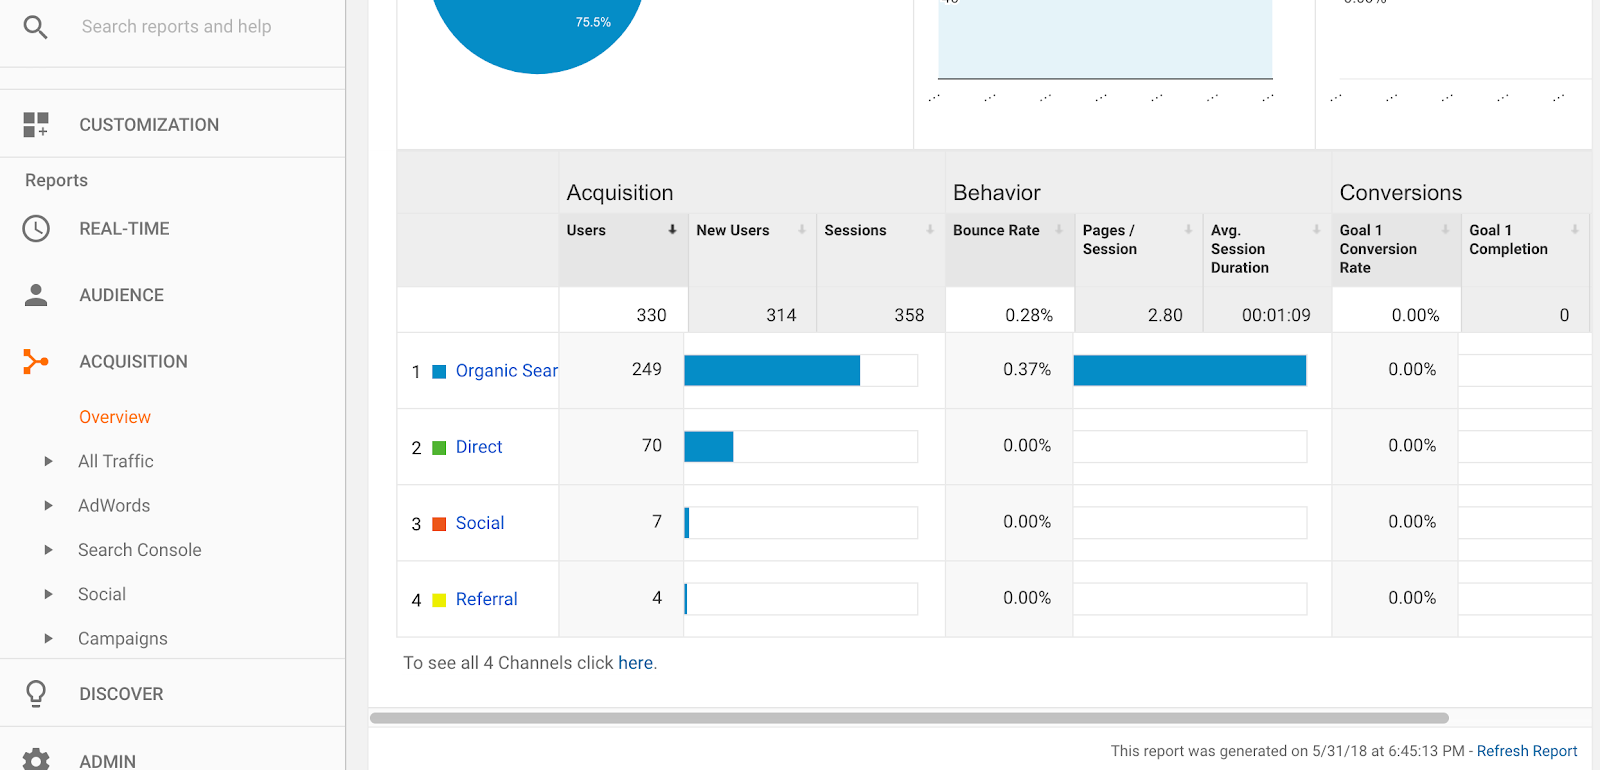
Every person who visits your website discovered it somewhere. In most cases, people will learn about your site because of the work you do to make it easy to find. The Acquisition metrics in Google Analytics show you which of your marketing or promotion efforts are doing the best job to bring people to your site.
In the Acquisition section of Google Analytics, you’ll see a breakdown of where all your traffic is coming from, divided into four main categories:
- Organic Search – All visitors that find your website when it shows up in a search engine (mostly Google, but also includes Bing and Yahoo data).
- Direct– Visitors that Google doesn’t have clear data about how they found the site. Usually that means they either typed your URL directly into the browser or came via a bookmark.
- Social – This is all the visitors who found you from a link on a social media website.
- Referral – Any visitor that came to your website from a link on another website.
In the Overview section, you can see how many visitors to your website came from each of these categories, but you can also go a little deeper to find out more about the visitors that come from each source.
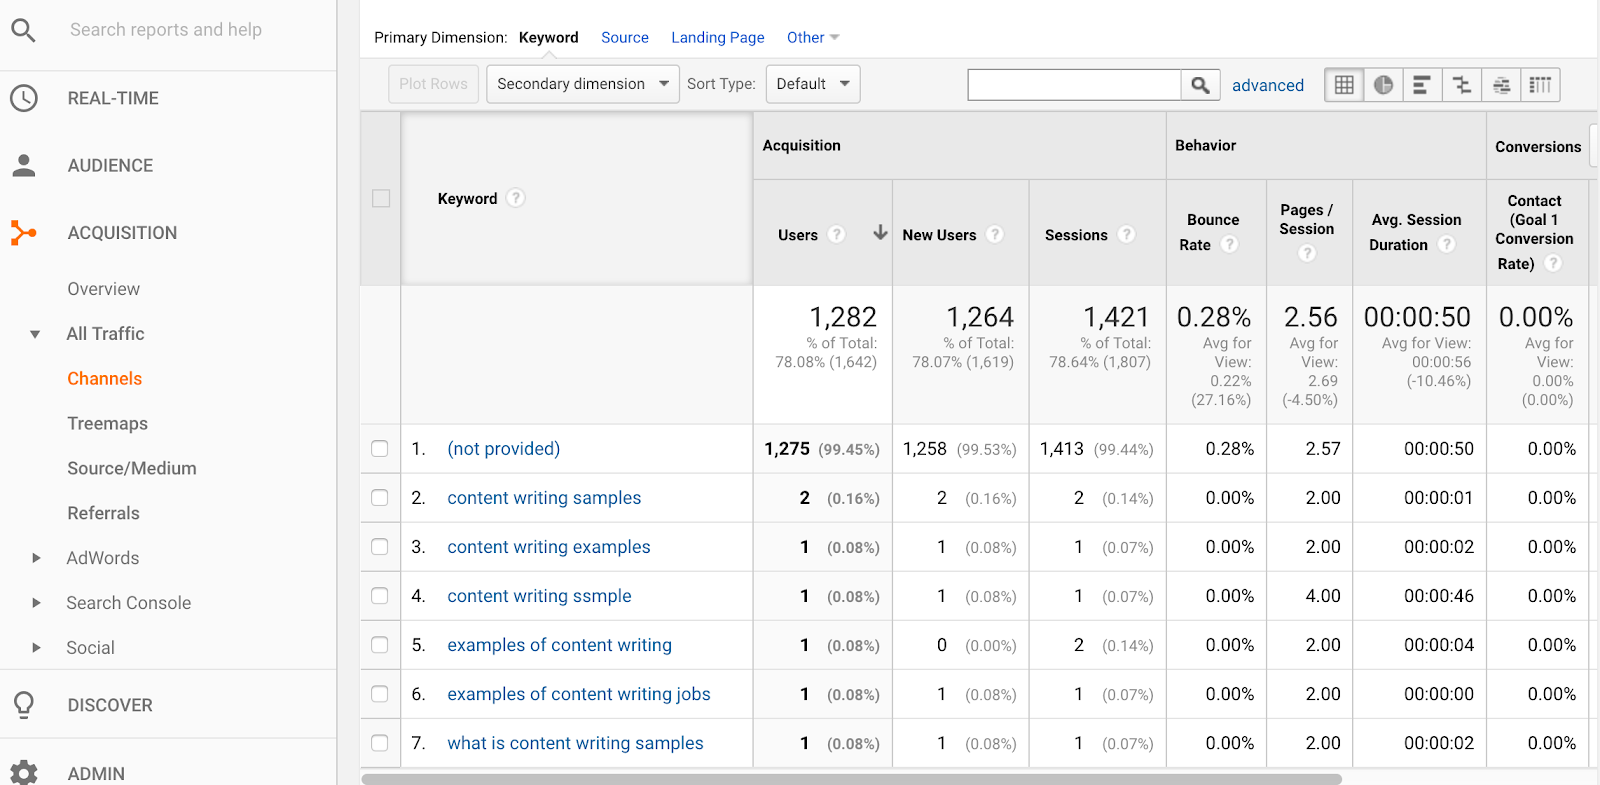
Search Traffic
When you click on Organic Search, you’ll come to a page that provides the terms people searched in order to find your website. This data is useful for providing insight into what keywords your web pages show up for in the search engine.
Unfortunately, you’ll almost certainly see (not provided) as the top result here. Google started limiting how much keyword information it would provide to protect user privacy a few years ago, so there’s a lot of keyword data you won’t see here. Even so, what you do see can be helpful to figuring out if your SEO efforts are paying off and how.
To figure out which pages those keywords lead people to, select Search Console under the Acquisition menu and Landing Pages. You’ll see a list of the most common pages people come to via search, and you can click on each page to see a list of the search terms people used to find it.
Direct Traffic
Since Google doesn’t have a ton of information about Direct traffic, there’s less you can learn about this category in Google Analytics than most. But you can still see what pages are getting the most direct traffic.
Click on Direct Traffic in the Overview list to view the list of pages people access this way in descending order, with the most popular at the top.
Social Media Traffic
Social media is one of the main channels websites often use for promotion, so it makes sense that Google Analytics devotes a category to providing you data on your social media traffic.
When you click on the Social option in Overview, you’ll see a breakdown of how many visitors are coming to your website through each of the different social media websites.
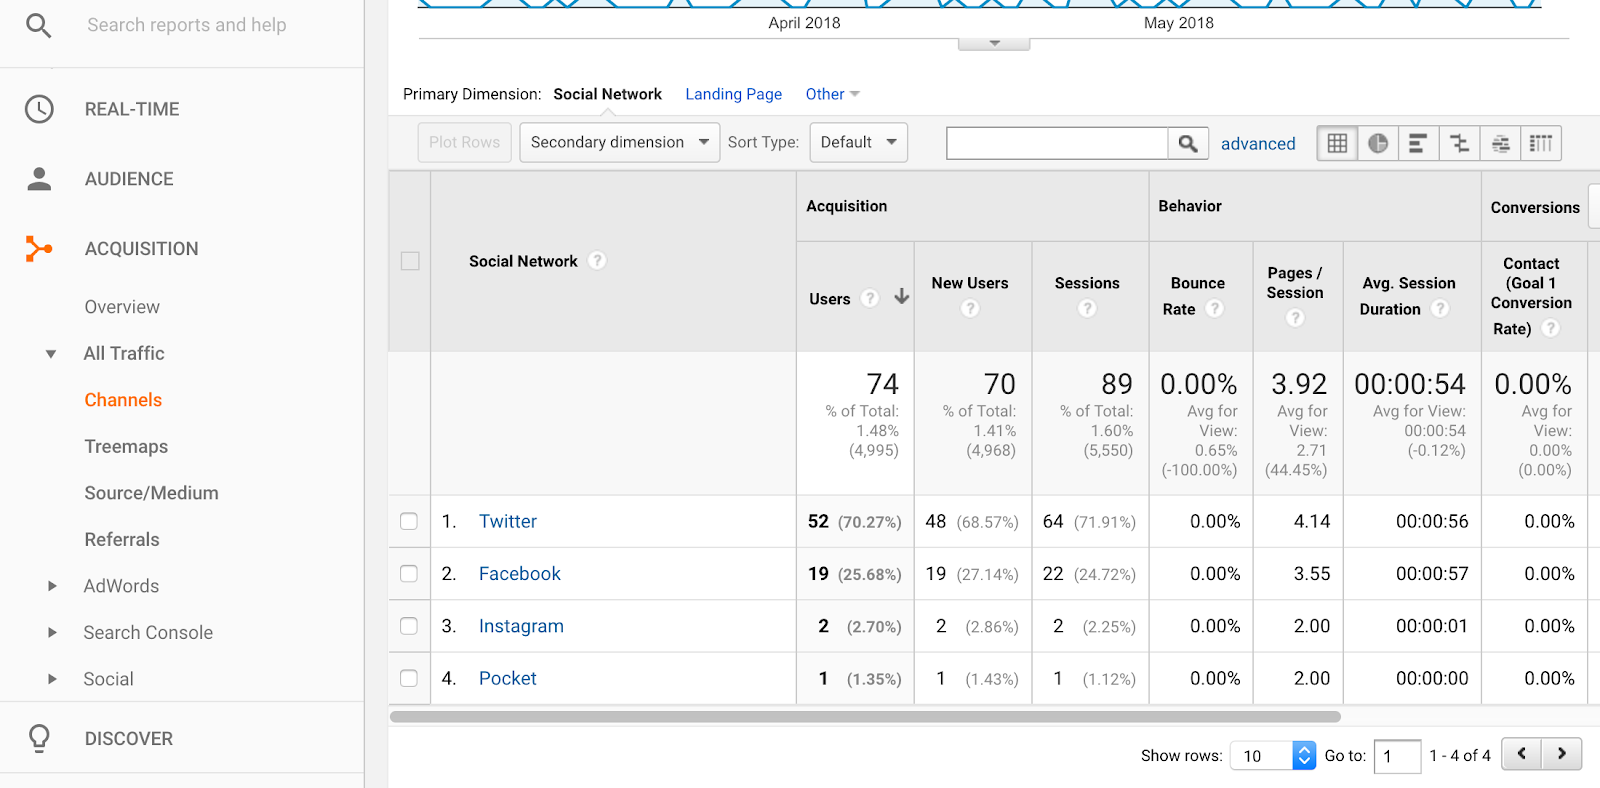
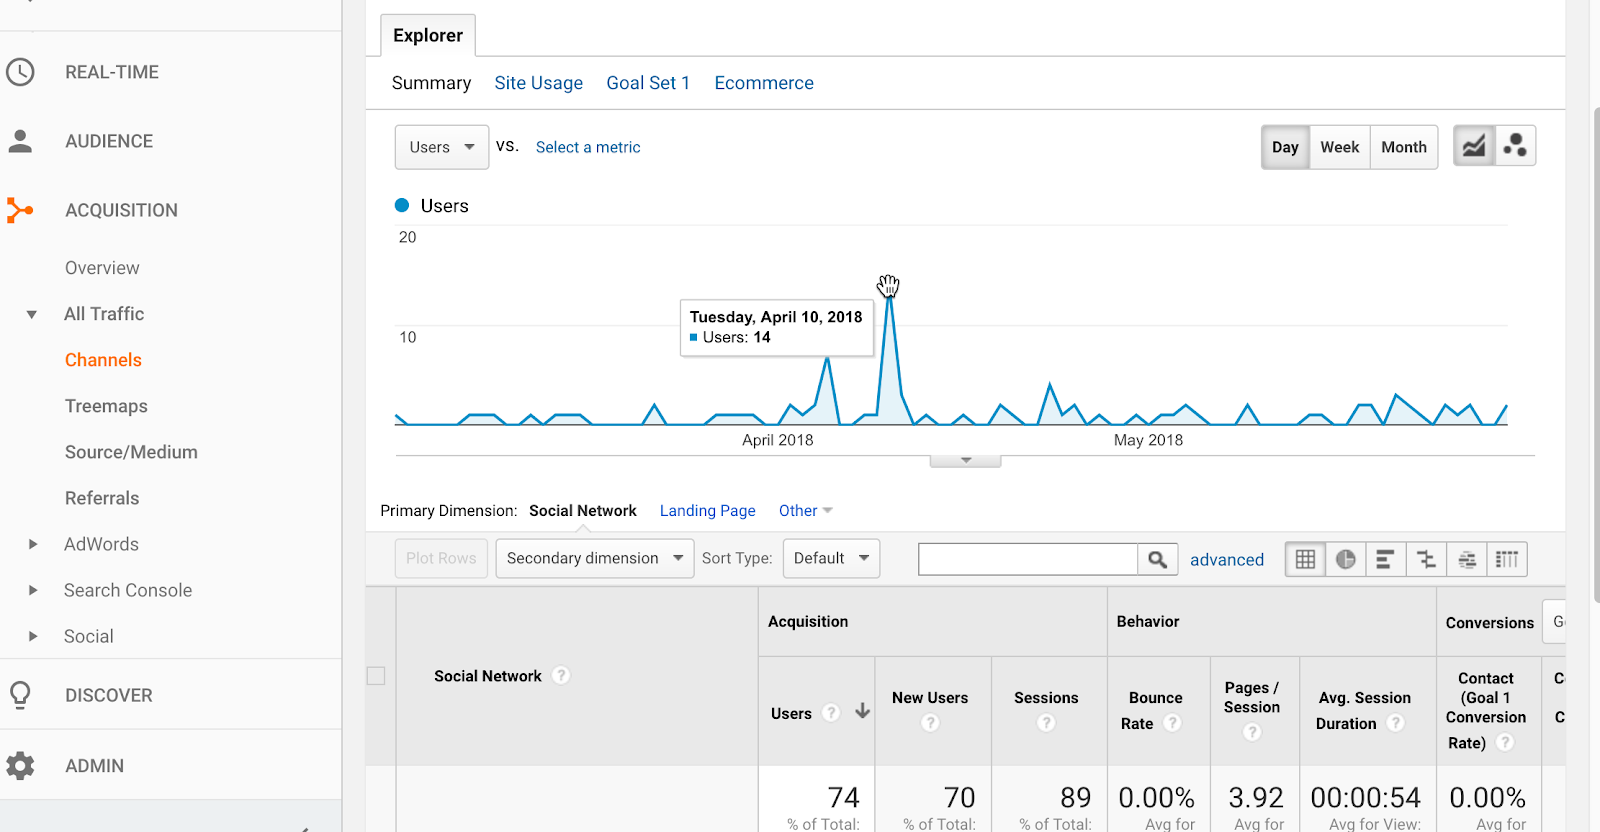
In the graph above the list, you can see how much social traffic you received by date. This makes it possible to pinpoint which social shares and campaigns lead to the traffic you received. You can limit the graph to a specific social channel by clicking the site’s name in the list below.
Referring Websites
If you’ve been working on SEO for your website, then you know how important it is to earn links from other websites. But SEO isn’t the only reason those links are valuable, they can also help you gain new traffic when people on the other site click on the link to your website. This section is where you learn which other websites that link to yours are sending you traffic.
When you click on Referral in Overview, you’ll see the list of websites sending you traffic, with the number of visitors sent by each.
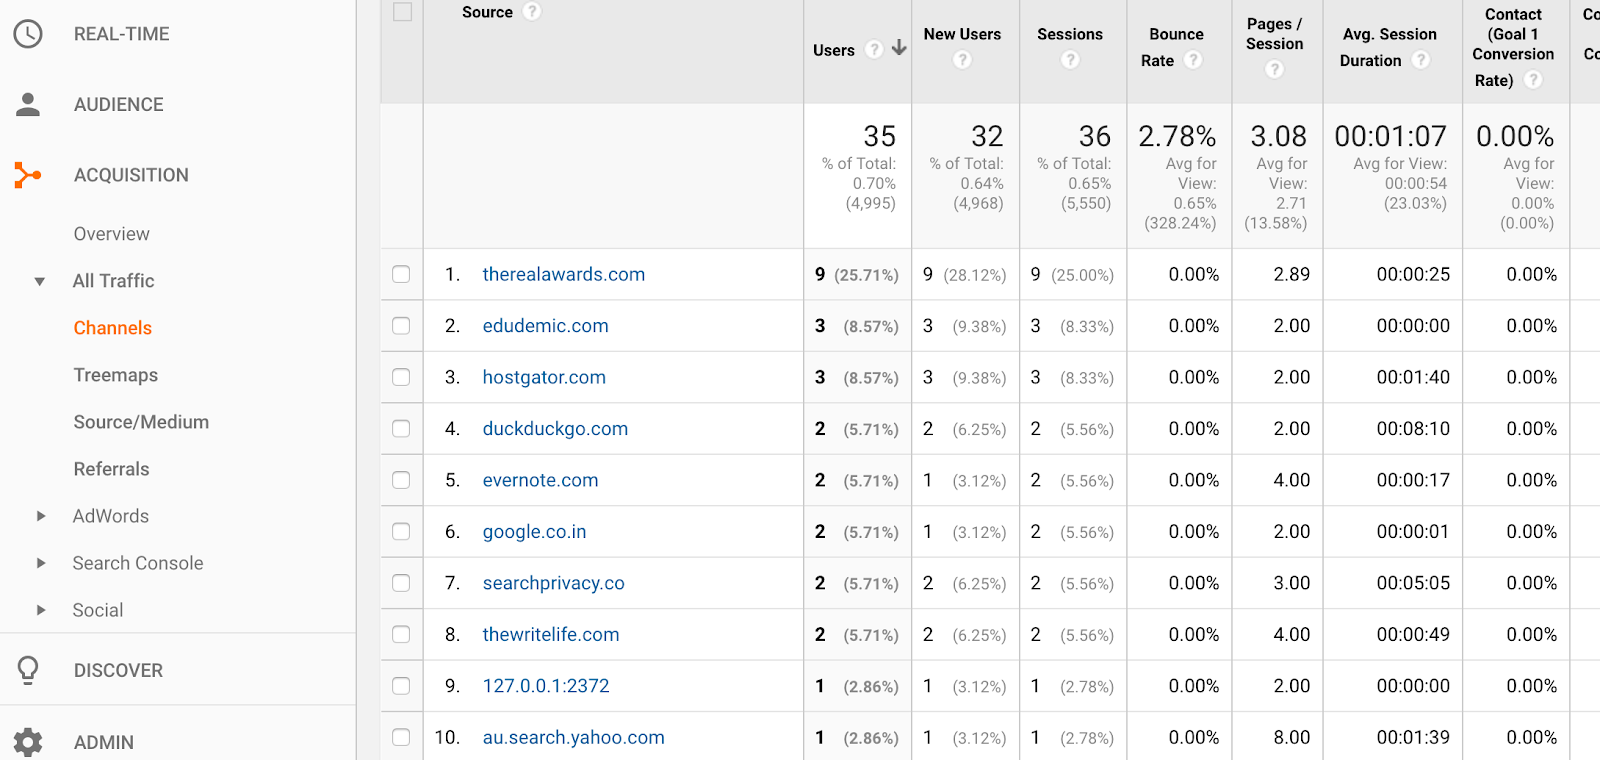
To learn when the traffic from each referral source came to your website, click the particular referral site in the list and see the number of visitors it sent by day in the graph above.
3. Who’s Visiting Your Website
Your website probably isn’t for everybody. Most businesses have a specific target audience that’s the most valuable for them to reach.
If you sell high-end vintage style bathing suits, your primary audience is probably something like women aged 20-40 who are into fashion and make enough money to splurge on stylish suits. Getting a visit from a 60-year old man isn’t a bad thing, but that’s not a visitor as likely to buy your products. If the majority of your traffic comes from people unlikely to buy your products, then you need to know so you can change your marketing approach.
Google Analytics supplies data in a number of categories that help you better understand who’s visiting your website and whether or not they’re the people you most want to reach.
Visitor Demographic Data
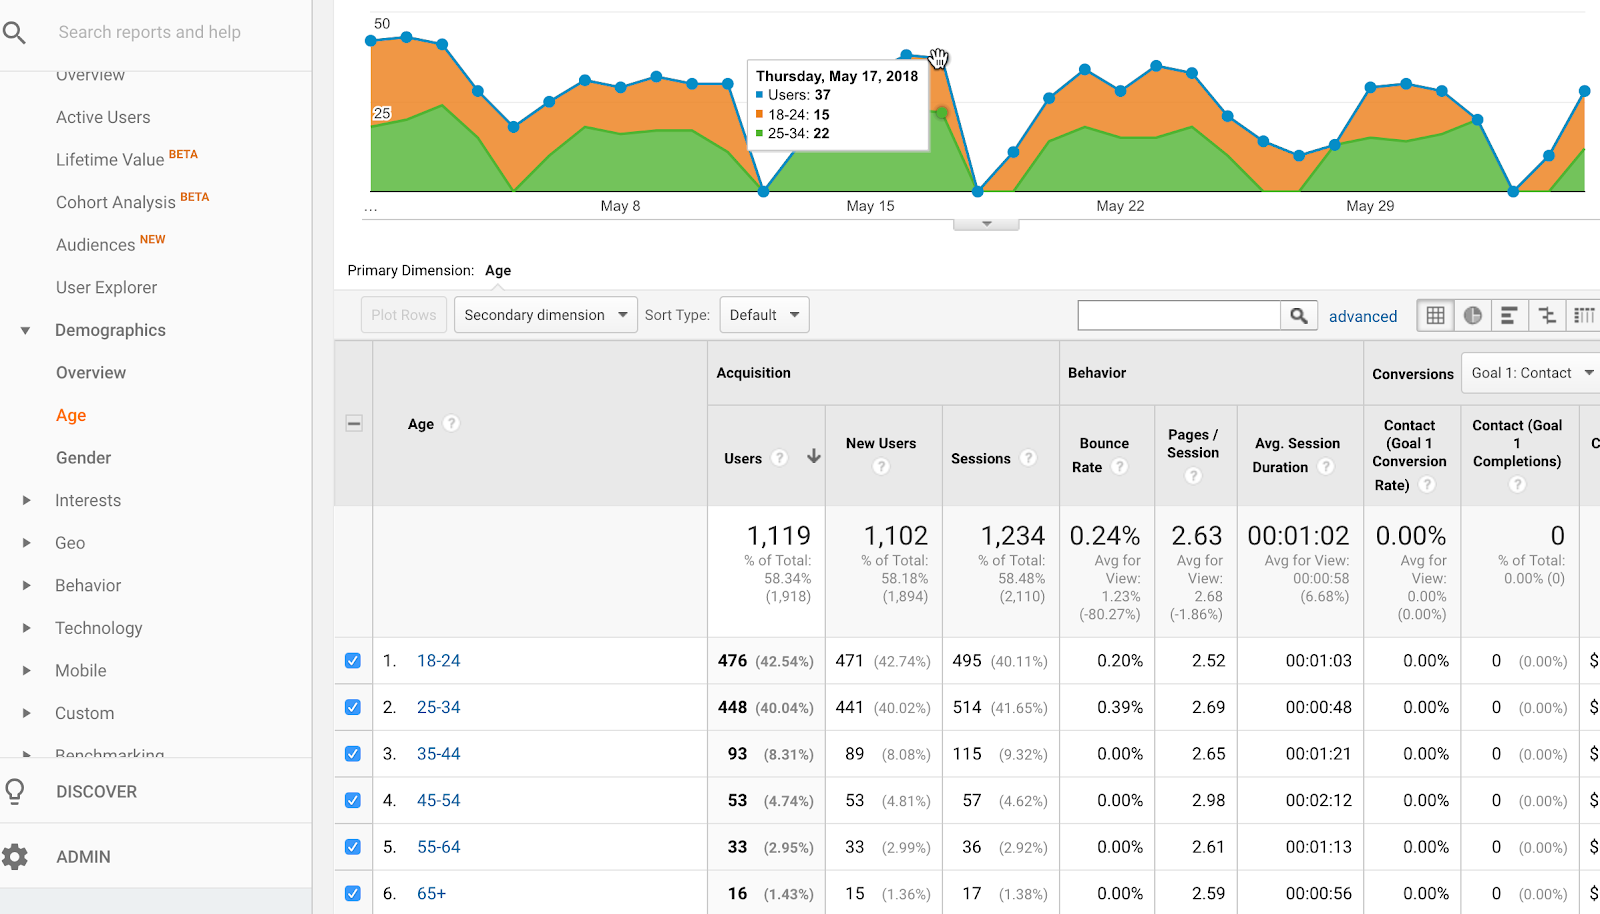
In the Audience section of Google Analytics, look for the Demographics section. In Overview, you’ll see a snapshot of your visitor breakdown by age and gender.
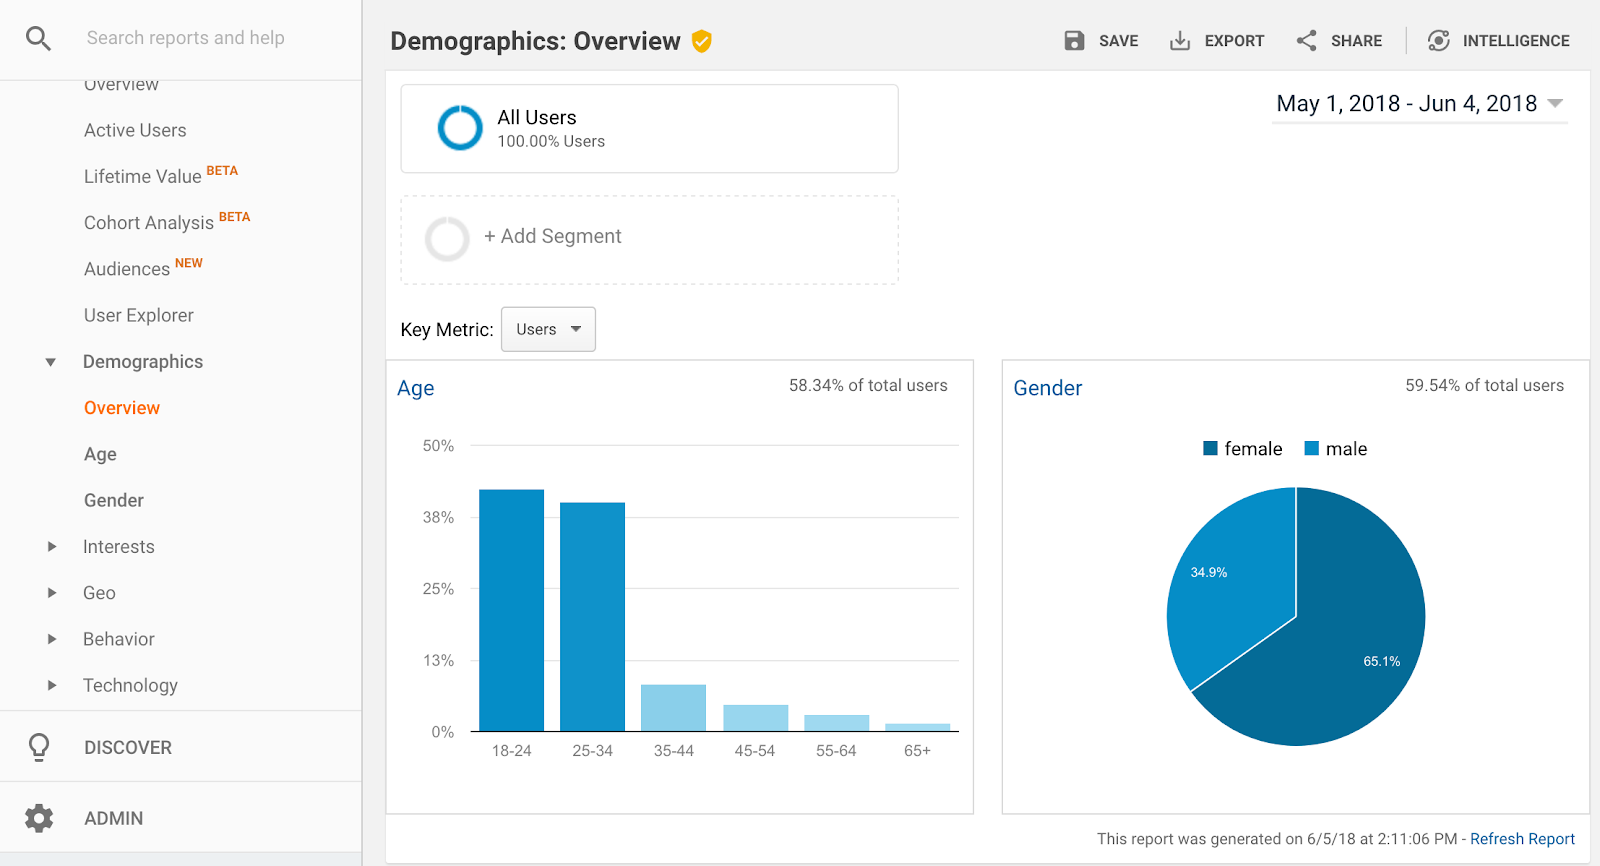
You’ll notice the graphs that show this breakdown include a note in the top right corner with the percentage of total users. Google doesn’t have this kind of demographic data on every single person that visits your website, but they do have information on a significant number of users that do their browsing while logged into a Google account (this could be through Gmail, Chrome, YouTube or one of any number of Google’s properties). Even though this information isn’t captured for 100% of your visitors, the data here gives you a pretty good idea of who you’re reaching.
To dig a little deeper into each category of demographic data, click on either Age or Gender in the Demographics menu. You’ll see how the data breaks down by date and how behavior on the website varies for people in the different demographic categories.
Interests
Understanding your target audience isn’t just about gender and age. Your products are also more likely to appeal to people who have certain interests and habits. Google Analytics has you covered here as well in the Interests section under Audience.
The data in this section is divided into three main categories:
1. Affinity categories – This section provides information on ways your visitors might identify based on their data history, such as News Junkies or Fitness Buffs.
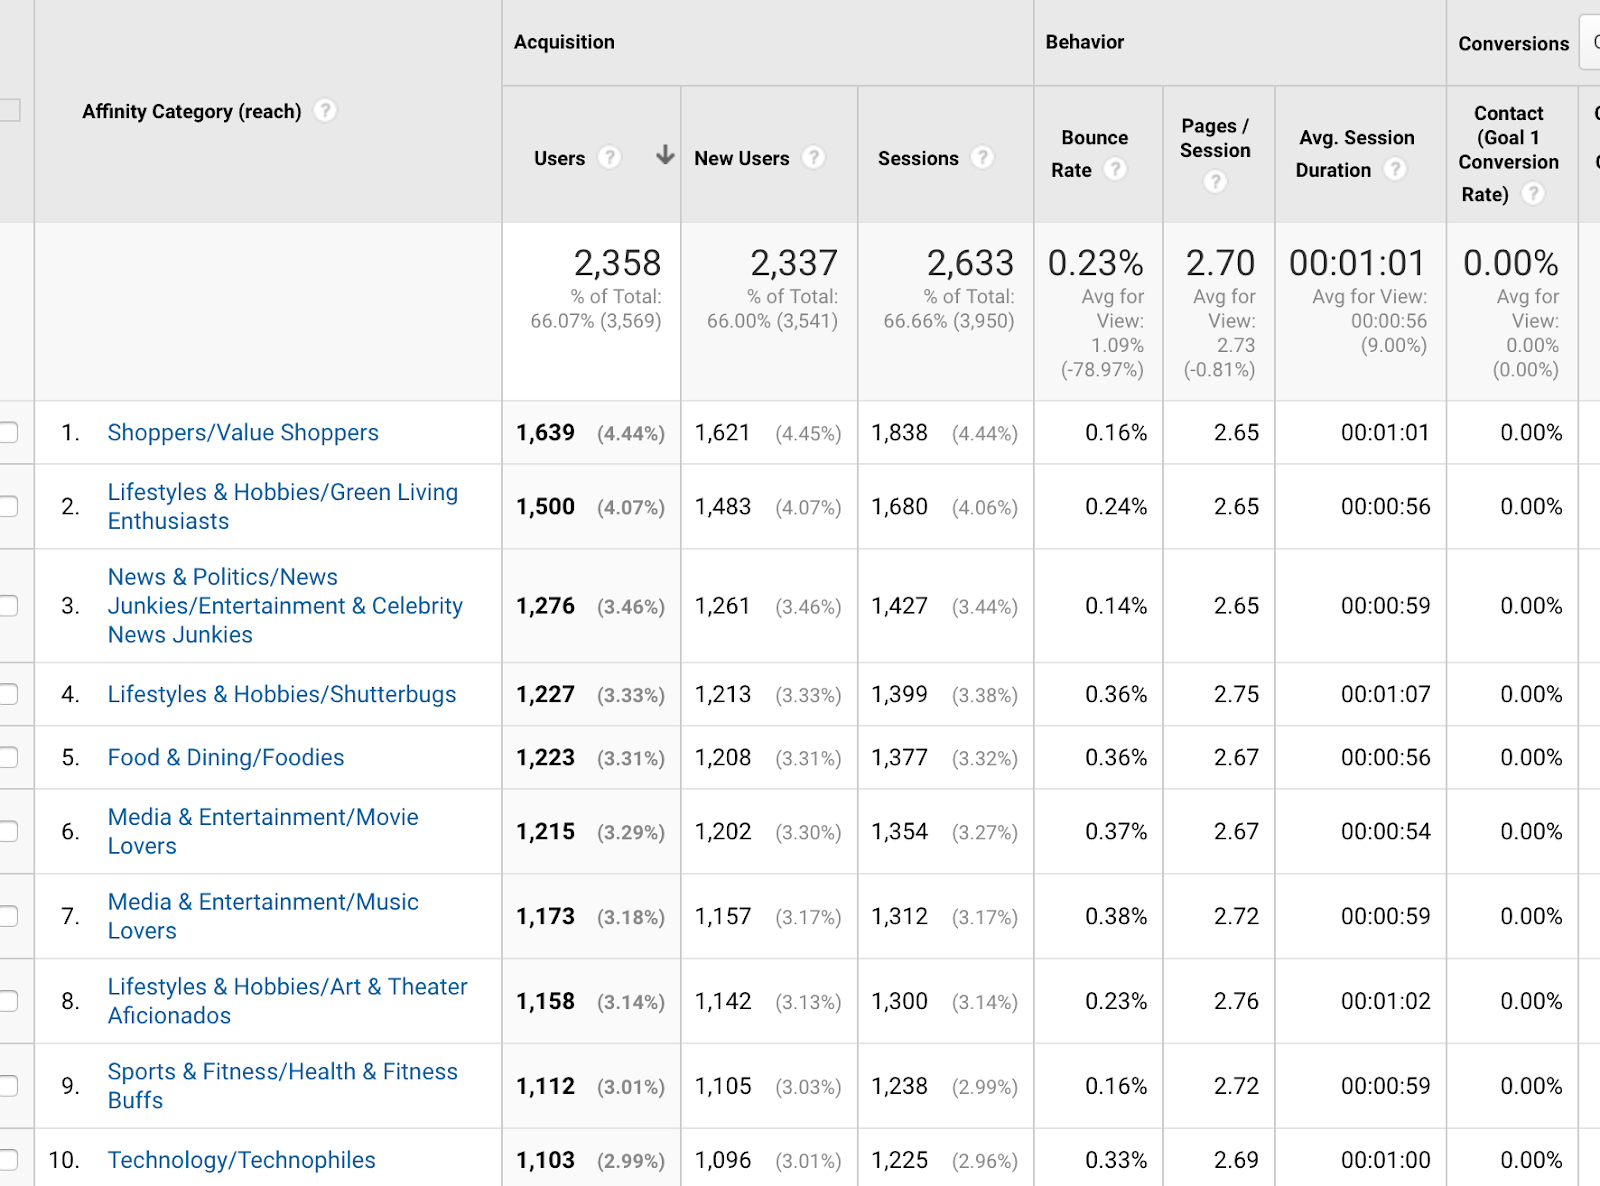
2. In-market segments – This category is based on what users’ browsing habits suggest they’re looking to buy, such as those planning a vacation or looking for marketing services.
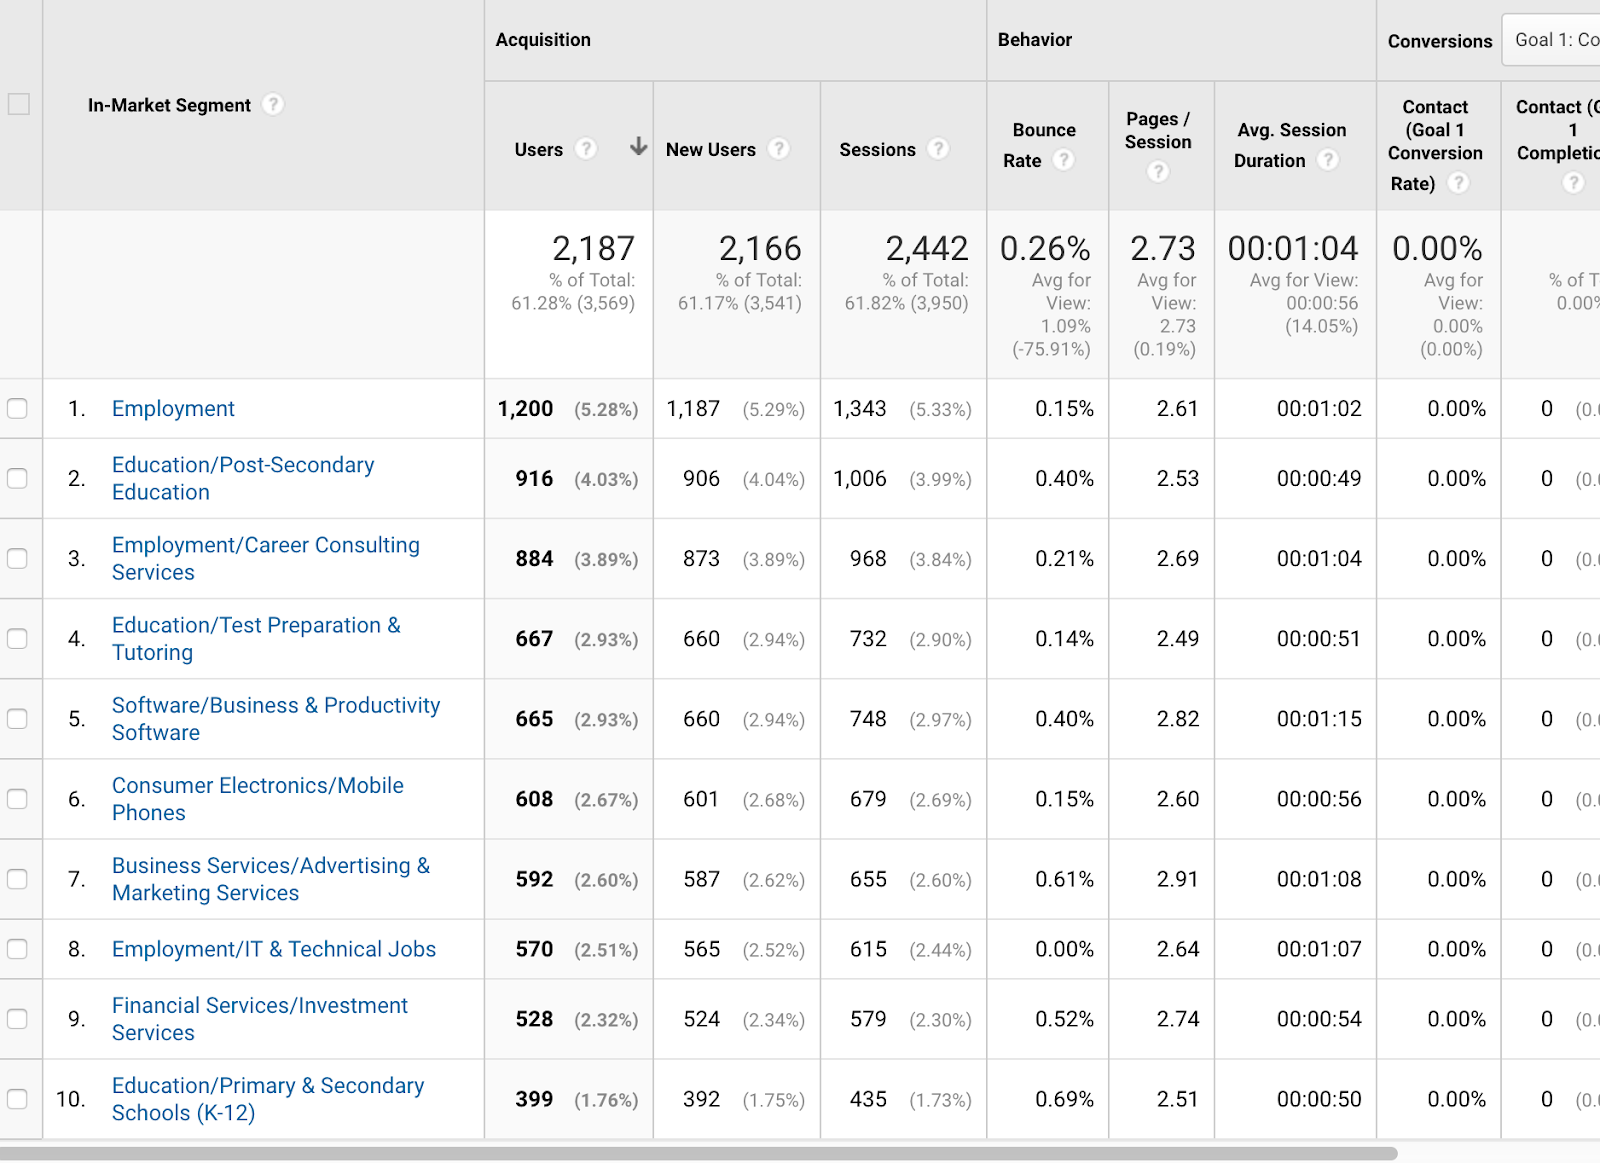
3. Other categories – This section provides information on other topics your visitors are commonly interested in, such as Celebrities and Entertainment News or Job Listings.
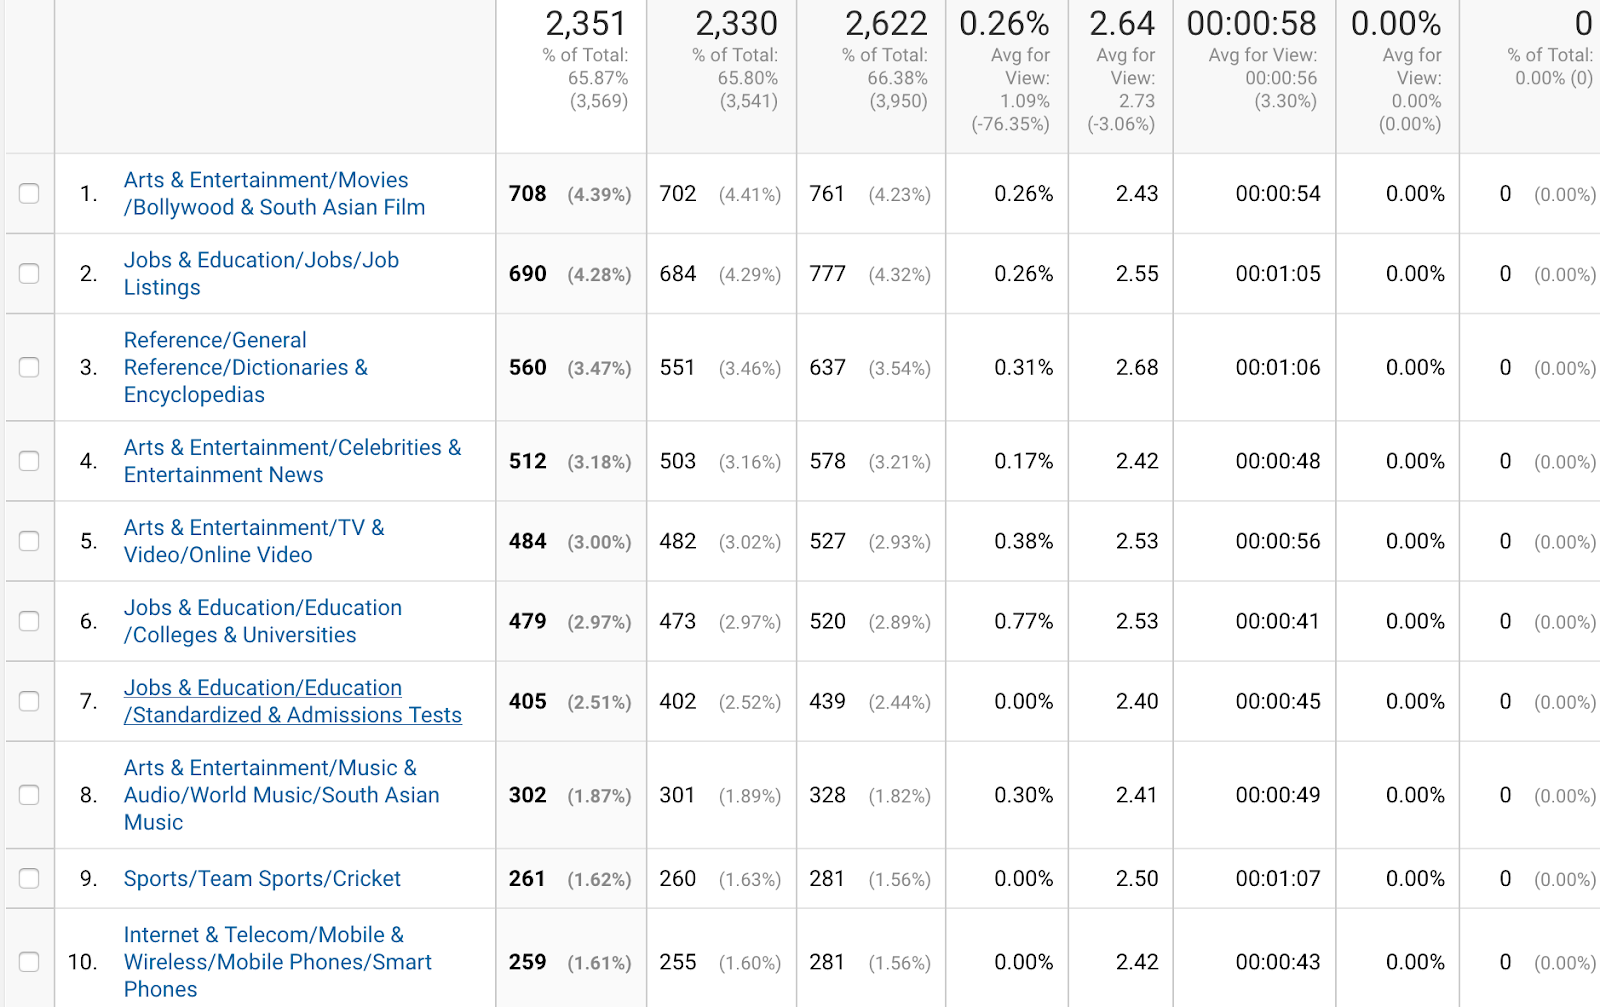
Google provides both top-level categories here, with more specific subcategories separated by a slash (e.g. Lifestyles and Hobbies/Green Living Enthusiasts). As with the other data, you can see how behavior on your site varies for visitors in each of the Interest categories provided.
Visitor Geography
Whether your business is international or only serves a local audience, it’s useful to understand where your visitors are located.
In the Audience section of Google Analytics under Geo, select Location to view the list of countries your visitors come from and how many visitors you get from each.
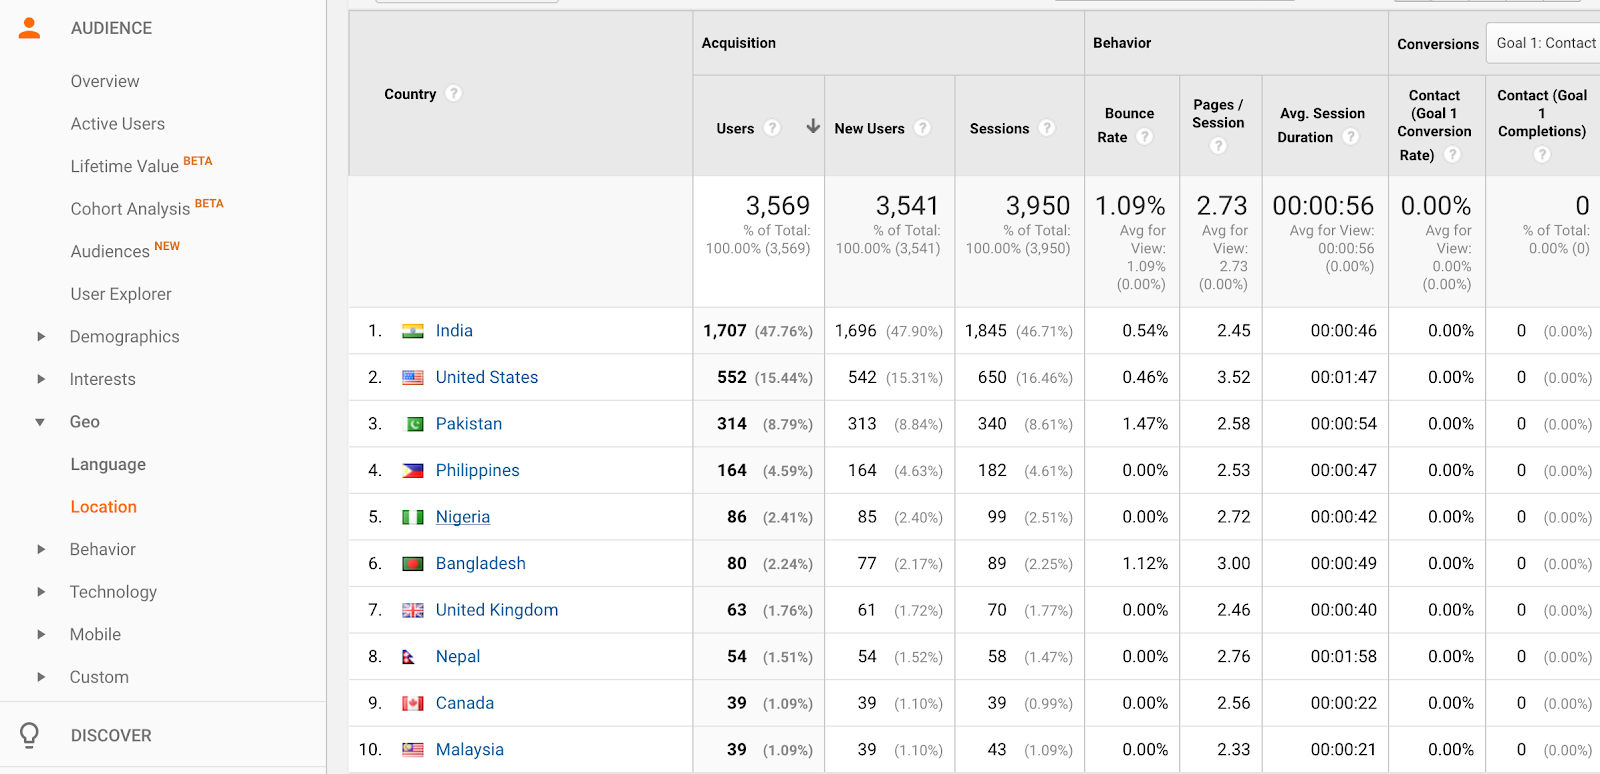
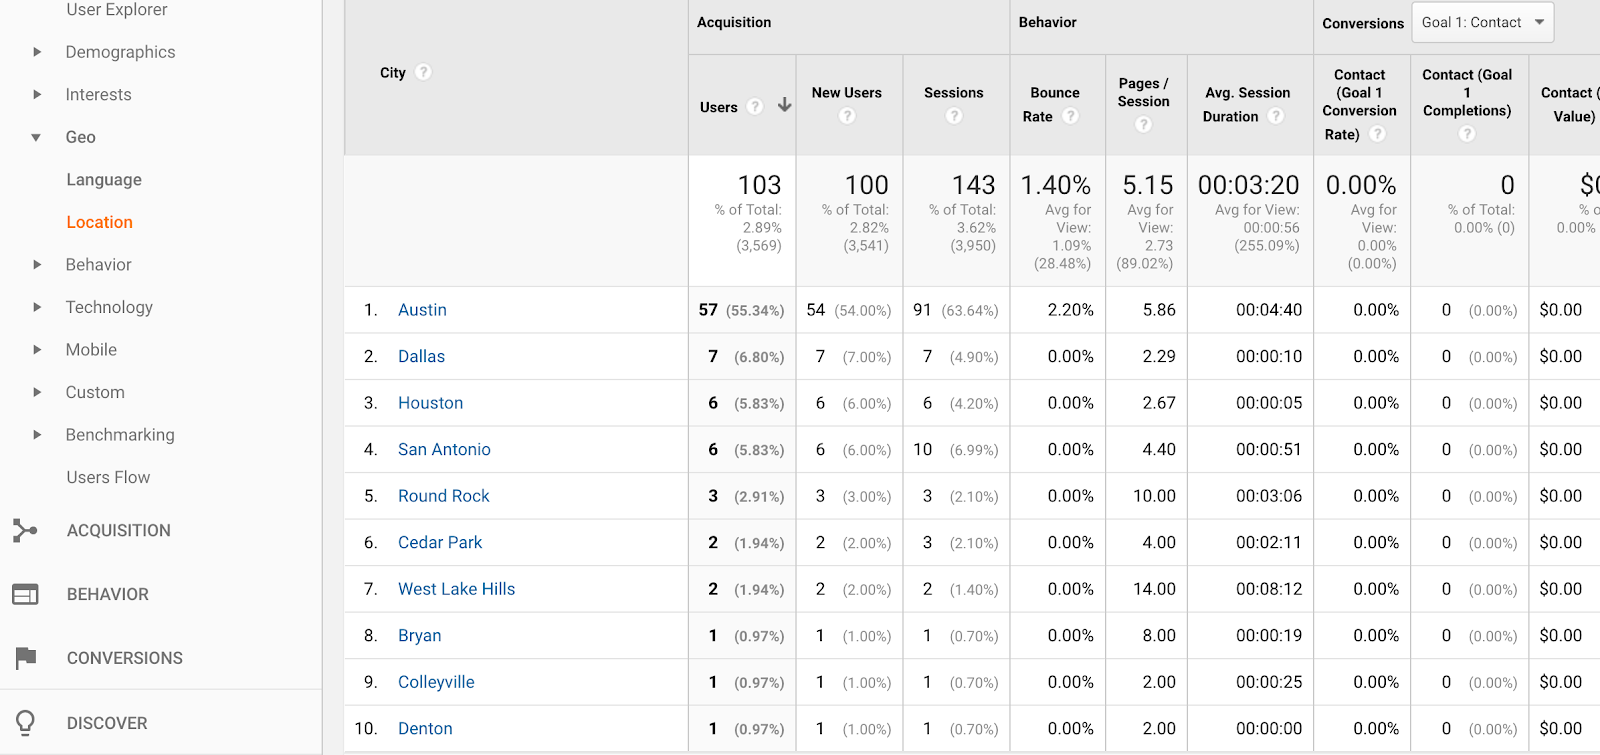
You can dig into that information to see where in each country visitors come from by clicking on the country. In some cases, you can go even deeper by clicking on the state or region to pinpoint the cities visitors come from.
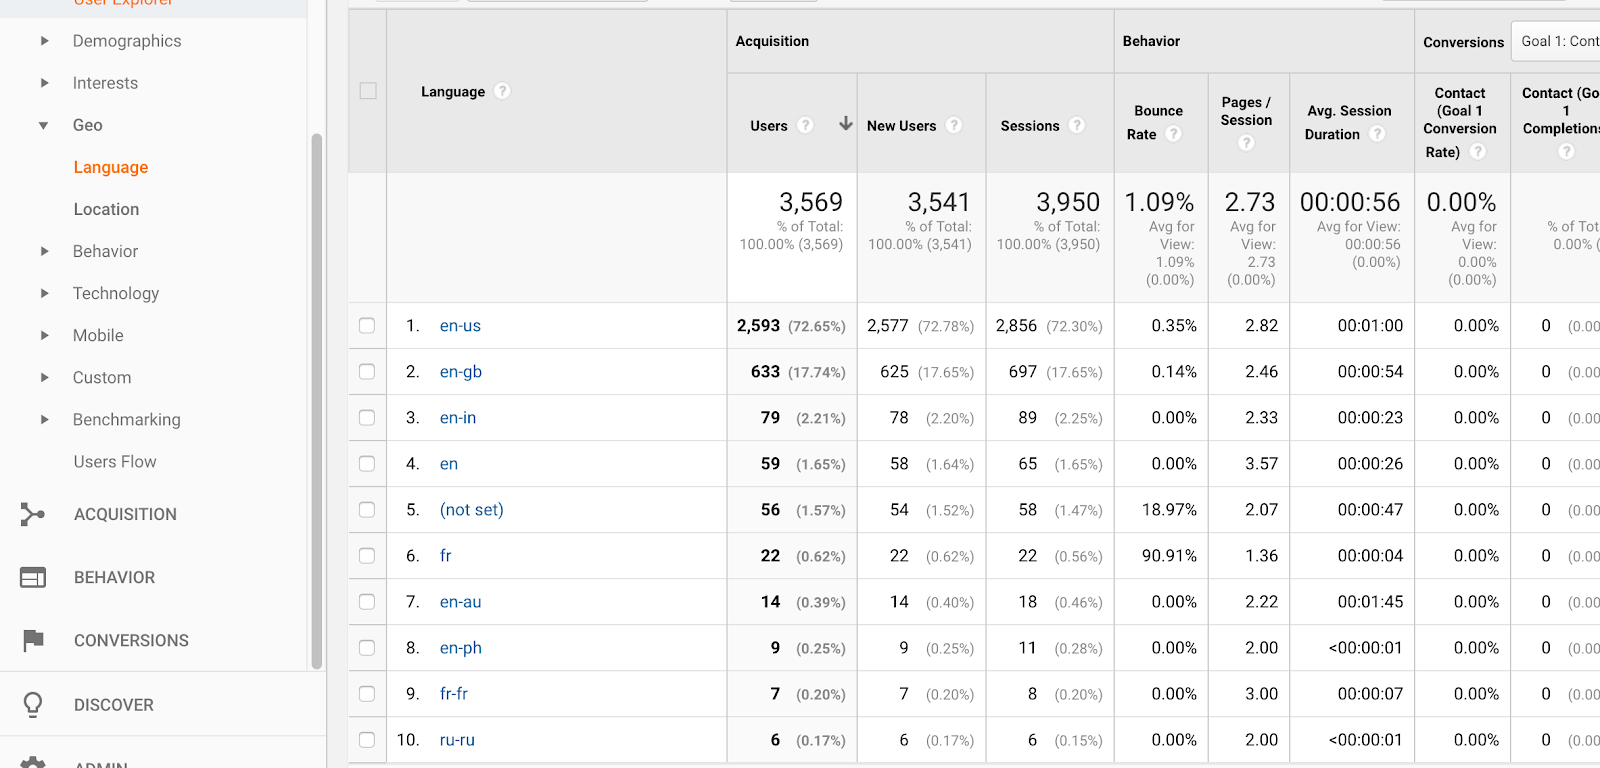
You can also learn the main languages used by your visitors by clicking on Language in the Geo menu. If you have an international audience and you notice a lot of your visitors speak a language your website isn’t translated into, it could point you toward a significant opportunity for reaching a new audience more effectively.
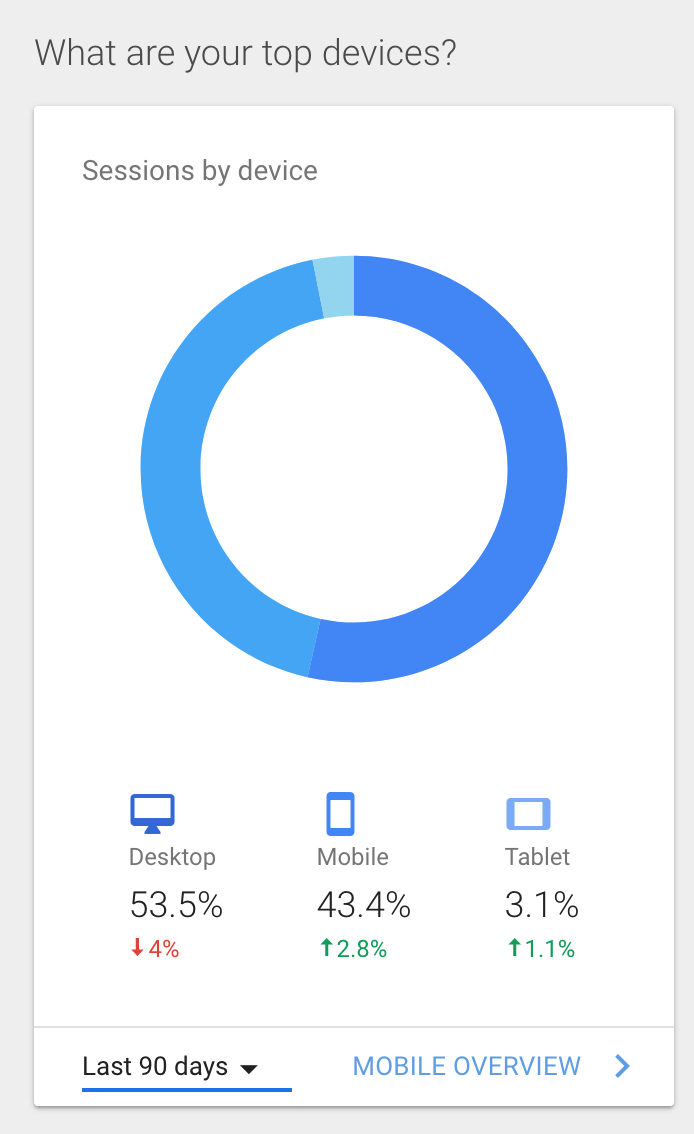
Devices and Browsers
People interact with a website differently when they’re sitting at a desktop computer than when they’re browsing on their phone, and websites sometimes look different when accessed via different browsers. It pays to understand how each person who comes to your website is experiencing the site.
Back on the Home page of the Google Analytics dashboard, you can get a snapshot of which types of devices your visitors are using.
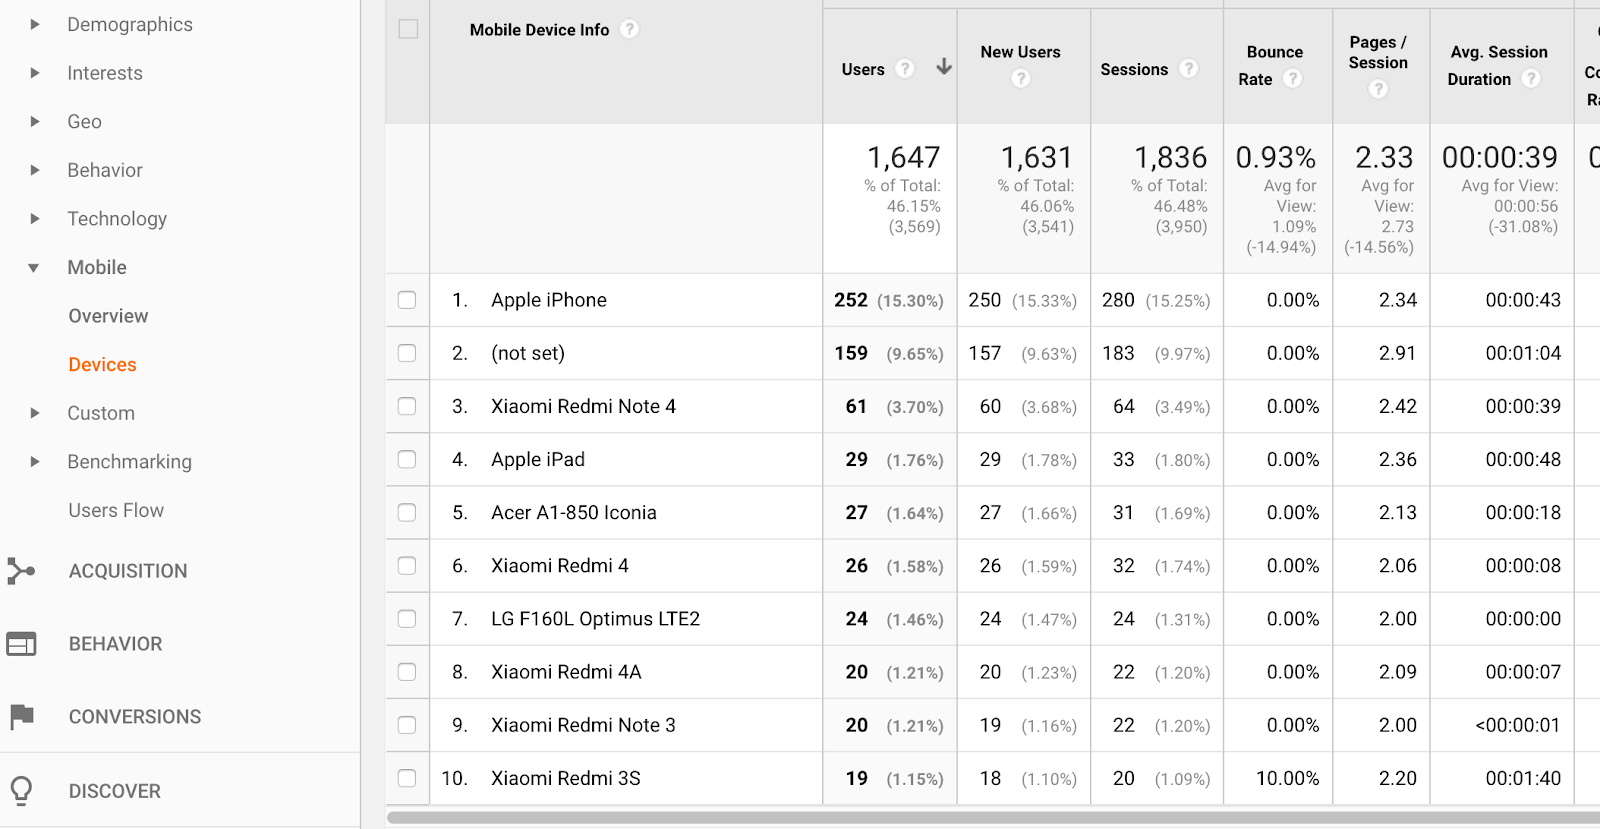
In the Audience section under Mobile, select Devices to see the specific mobile devices your visitors view your website on.
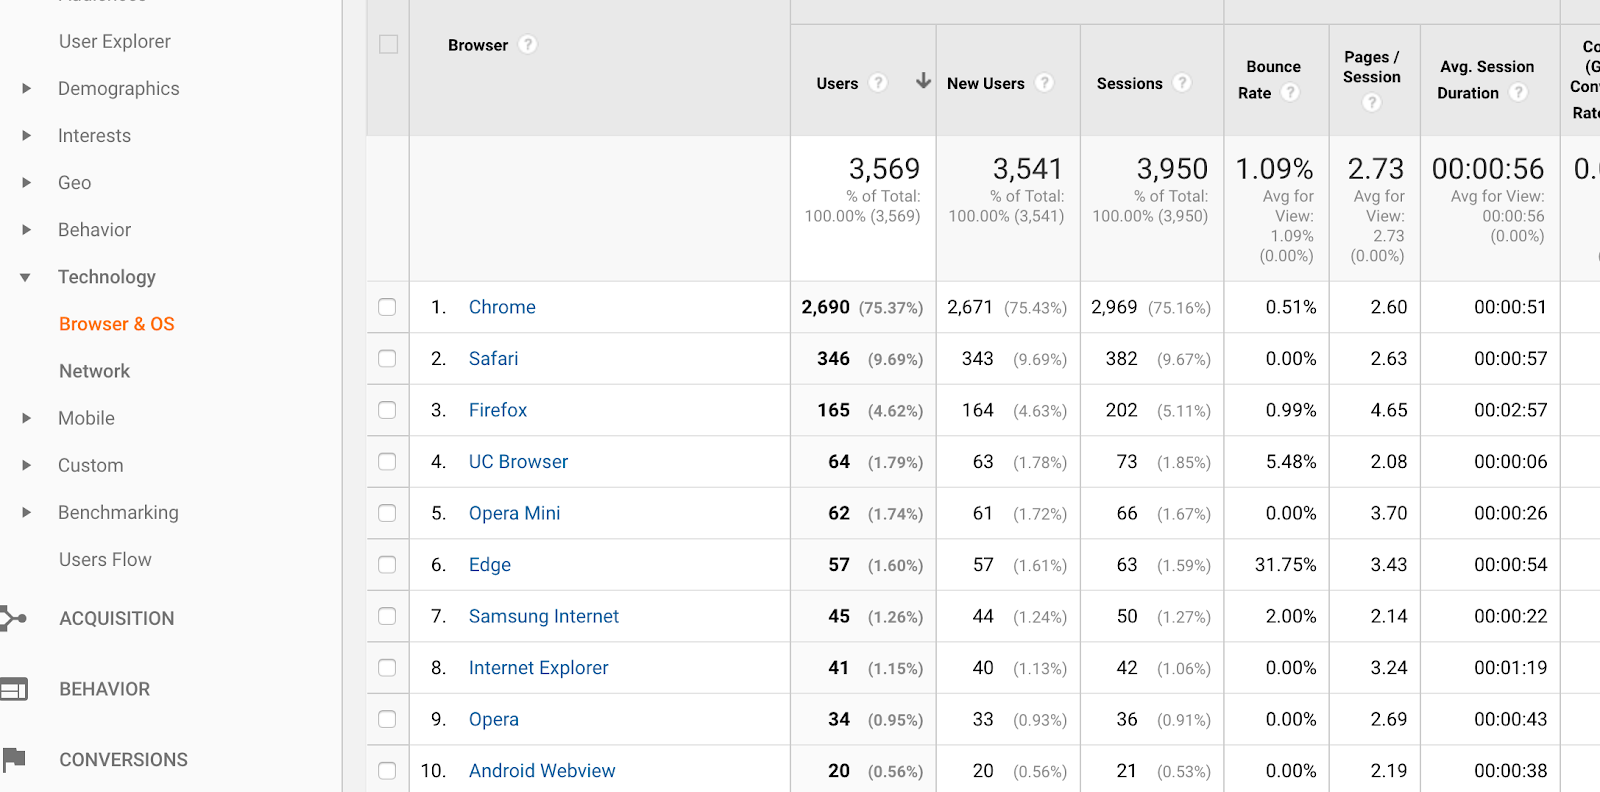
Under Technology, you can see what browsers people are using when they visit your website. You may be surprised to see some that aren’t the most common or mainstream options. This is a good reminder that when you’re testing out your website you should go beyond the big three.
4. What People Do Once On Your Website
Getting people to find and visit your website is an important part of its success, but that first click is ultimately less important than what they do once they get there. Someone that clicks away immediately is far less valuable to you than a visitor that sticks around for a while, visits multiple pages, and comes back again later.
Google Analytics provides a number of metrics that provide insights into what people do once they land on your website.
Some of the most important information is displayed alongside many of the other Analytics categories we’ve seen, so you can see how behavior metrics relate to other categories. On the charts included on pages throughout Google Analytics, you’ll see:
- Bounce Rate – This is the number of visitors who come to your website and leave without visiting any page beyond the one they landed on. In some situations that could be an okay thing – a person found what they needed, was satisfied, and moved on. But generally, you want visitors that spend time looking around on your website before leaving.
- Avg. Session Duration – This tells you the average amount of time visitors spent on the website before leaving.
- Pages/Session – Like it sounds, this is the number of individual pages a person visits while on your website before leaving.
In addition, you can find a few other types of useful behavioral data.
Behavior Flow
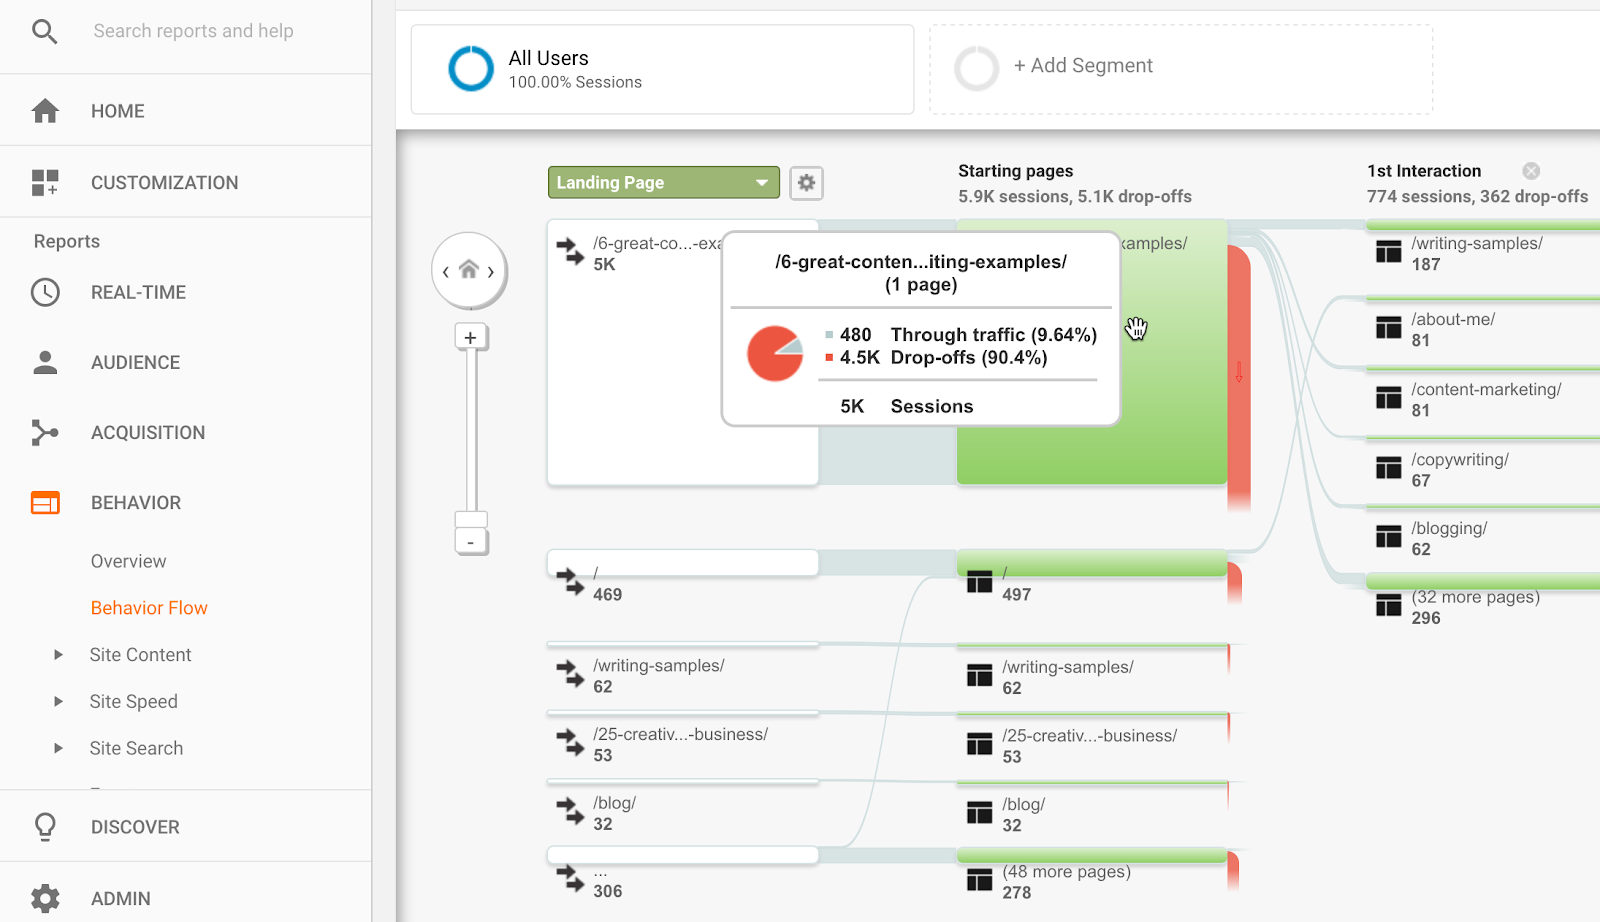
Knowing how many visitors stick around to visit more than one page on your website is useful, but that brings up the obvious question: when they move from one page to another, where are they going? The Behavior Flow section in the Behavior menu answers that for you with a visual chart.
You’ll see the main pages visitors most frequently start out on next to the pages they often move to from there. For visitors that go to more than one page on the site, scrolling to the right will show you the additional pages they navigate to.
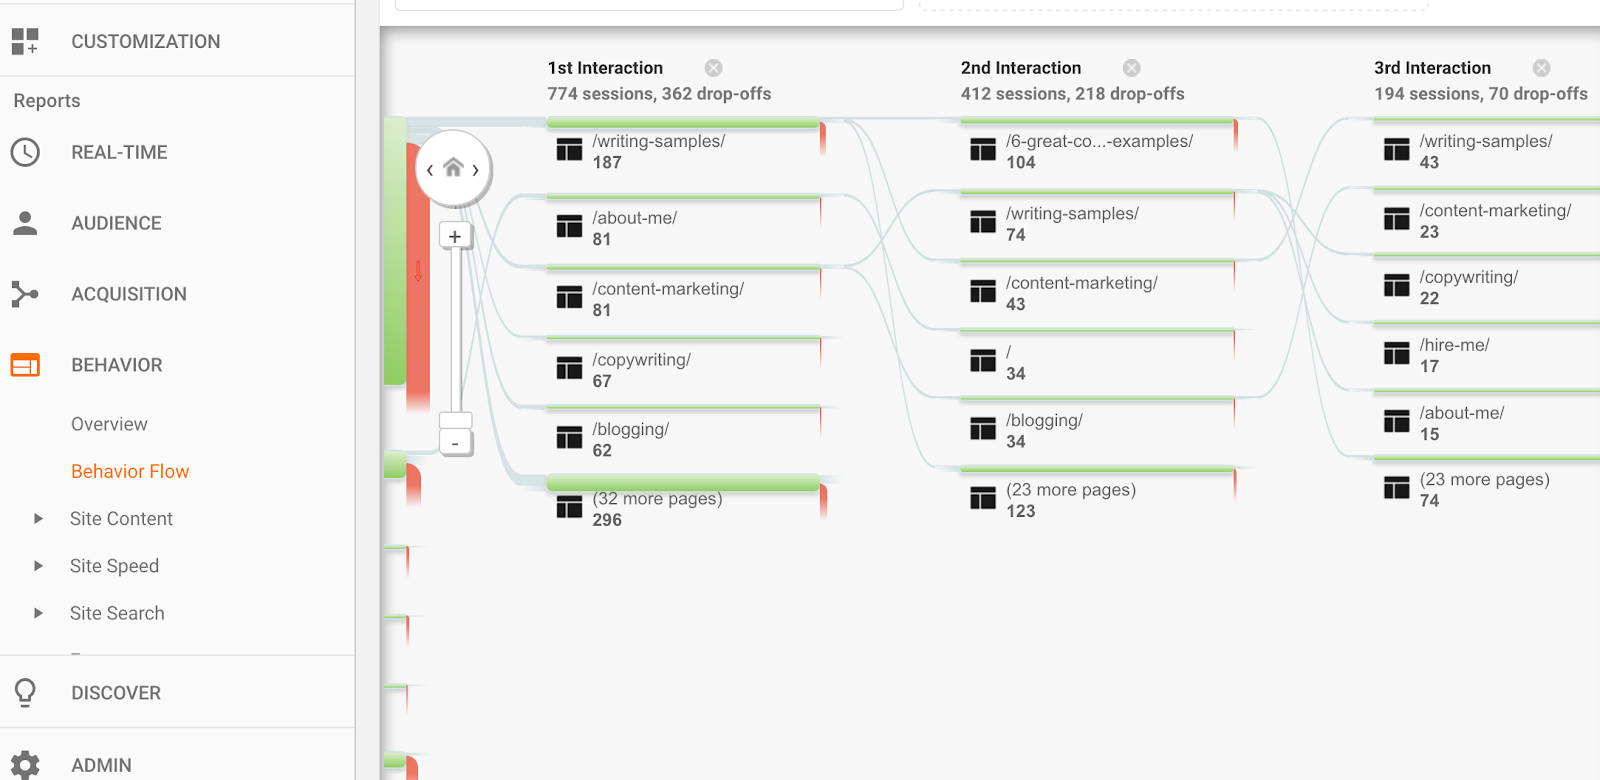
You can mouse over each part of the graph for more specific data.
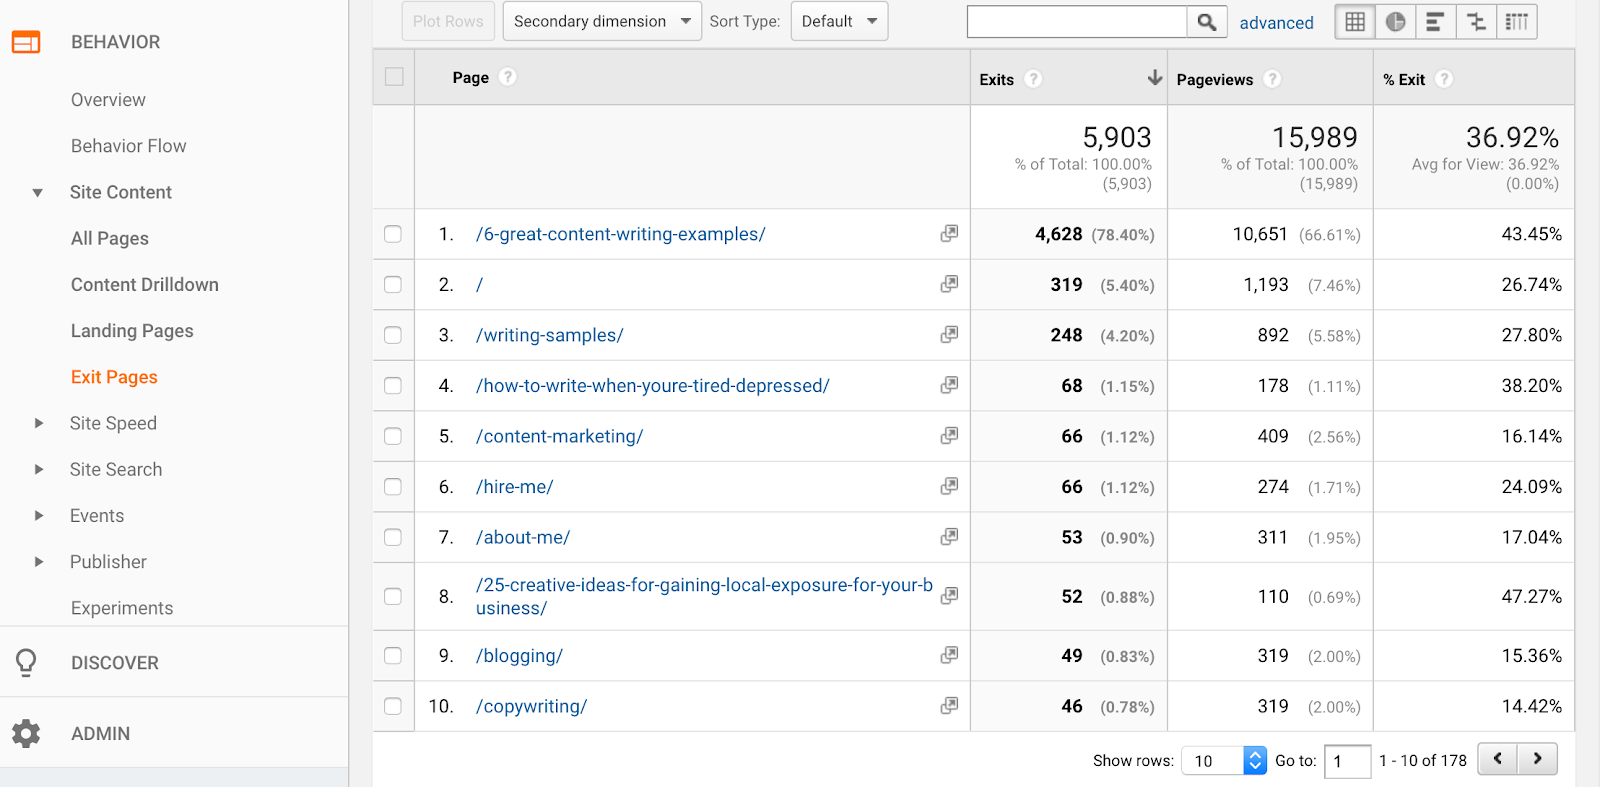
Exit Pages
In the Behavior menu, under Site Content, select Exit Pages. Here you’ll see the pages most people are on right before leaving your site, as well as the percentage of how many visitors to that page also exit from it.
In a lot of cases, this list will look a lot like the list of your top landing pages. Keep in mind that it’s normal for a lot of visitors to leave a site after visiting one page. But this data can help you figure out if some pages are doing a particularly bad job of keeping visitors to your website around, and identify opportunities for internal linking or CTAs that could encourage visitors to stay longer.
Events
The Events section in the Behavior menu provides data on actions people take on your website other than moving from one page on the site to another. That can include clicking on outbound links in your content, playing a video included on your website, filling out a form, or completing a download.
The Events analytics are a really good way to track how much people are engaging with your website and taking the actions you most want them to take when on a page.
5. How Many Users Convert
For business websites, many of the metrics we’ve already covered are ultimately less important than your main goal of conversions. You want people who come to your website to take action – whether it’s making a purchase, contacting you, or signing up for your email list.
Google Analytics makes it possible to track these kinds of actions by setting up conversion tracking. It requires a little more work to access conversion data than the other data types we’ve covered so far, but it’s the best way to measure how well your website is meeting its primary goals.
What Is a Conversion?
This part is largely up to you. You can set up conversion tracking for every time a visitor makes a purchase, any time they sign up for your email list, whenever they fill out a form on your website, or when they visit specific pages in a set sequence. Most businesses will want to use conversion tracking for multiple types of conversions.
How to Set Up Conversion Tracking
At the bottom of the menu, select Admin. On the menu on the right side of the page, select Goals. Click on the button to set up a New Goal, and you’ll see a helpful template provided by Google Analytics to get you started.
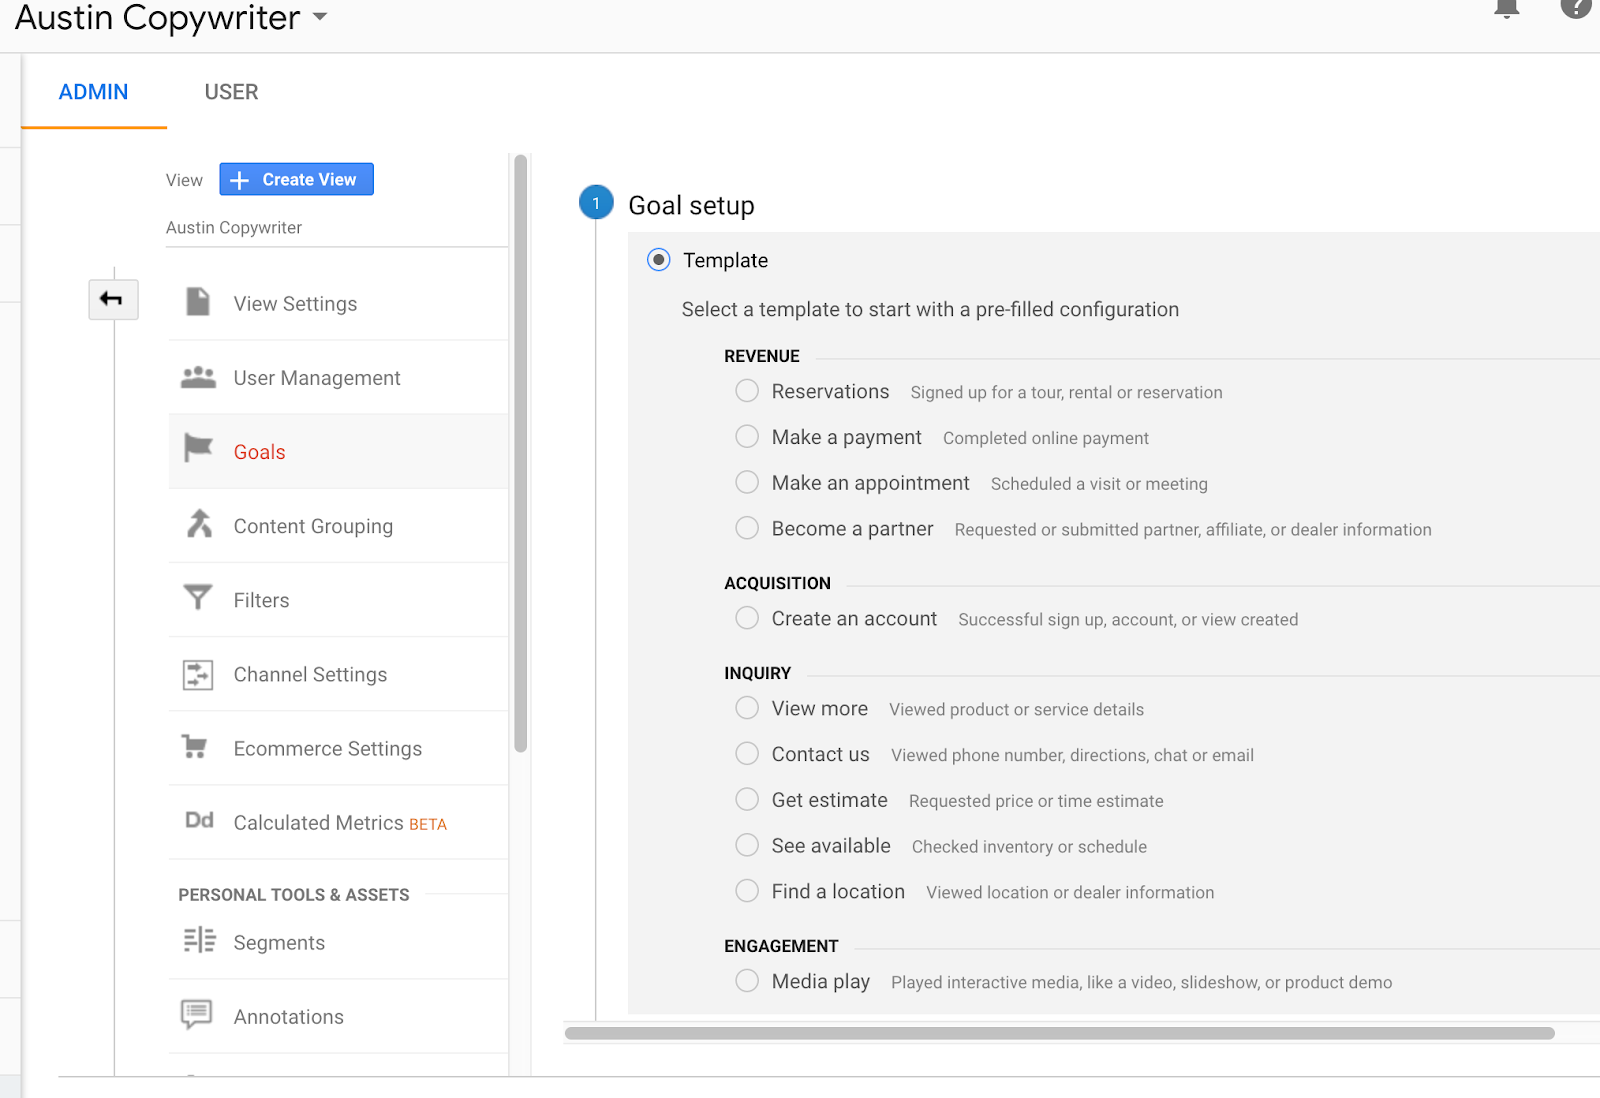
Follow the instructions provided to fill in details for each conversion you’d like to track.
How to Find Conversion Data
Once you have conversion tracking set up, you can view conversion analytics in the Conversion section of Google Analytics. The data you see here will be specific to the conversions you set up, but may include:
- The number of visitors that completed each type of conversion.
- The total amount those conversions are worth (based on the value you’ve assigned them)
- Your overall conversion rate
This information will help you see which pages and online marketing activities are helping you achieve the main goals you’ve set, so you can tweak your strategy for improved results over time.
How Google Analytics Data Helps You
The data in Google Analytics enables you to see trends in how people interact with your website and what tactics, design attributes, topics, copy and content pay off the most in the types of actions you want people to take.
You can both dig down into detailed data on how specific types of users behave or how specific pages perform and zoom out to see the big picture of how your website is performing overall over long periods of time.
Even with all the information we’ve provided here, we’ve only covered the main features Google Analytics provides. As you get more comfortable with it over time, you’ll find even more valuable data to help you strengthen your marketing efforts and make your website better.
Improve Your Google Analytics Data
For Google Analytics to really start providing you the insights that are most useful, your website needs to bring in traffic. If you’re having trouble getting people to your website to begin with, consider hiring an experienced SEO specialist.
For you to get the benefit of demographic data, conversions, and everything else mentioned here – that first step of getting traffic to your website is required. Virtue Media’s SEO services can help with that part.


![Yes, B2B Websites Can Use Personalization Too [Here’s How]](https://mdvirtue.com/wp-content/uploads/2022/02/Yes-B2B-Websites-Can-Use-Personalization-Too-Heres-How-400x250.jpeg)

0 Comments