The thought process that leads to buying that candy bar you see in the grocery store checkout line is different from the one that brings you to the point of clicking “Add to Cart” on an eCommerce site.
And the path to clicking that button is different when you’re buying a big-ticket item like a new appliance than if you’re ordering something small like snacks or pet toys.
When you’re on the consumer side of the things, you don’t think too much about what the step-by-step process that leads up to each purchase looks like. But for eCommerce brands, gaining knowledge of the customer’s journey—the typical steps each new customer takes before deciding to buy—can help you design your website and marketing strategies to lead consumers to that point.
But it’s not like you can peer over your customers’ shoulders as they shop. To learn about customer shopping habits, where are you even supposed to start?
A good (and entirely free!) option is with Google Analytics.
3 Insights in Google Analytics to Understand Customer Behavior
Google Analytics is chock full of information every website owner will want to know (see some of the most important beginner features here). For eCommerce websites, a lot of that information will be crucial, but you also have a whole set of eCommerce specific analytics you’ll want to make use of in your analysis.
Here they are:
1. Shopping Behavior Flow
The shopping behavior flow report reveals how many visitors complete each action on the path to a sale. In a bar chart, from left to right, you’ll see the number of total sessions, then the number of sessions that included a product view, then the number of those that added a product to the cart, those that started the checkout process, and finally, the number that completed a transaction (score!).
Along the bottom of the report, in between each bar, Google Analytics helpfully provides the numbers behind the dropoff in each category. It’s normal for each bar to be lower than the one before. For example, if you do content marketing, you shouldn’t be too surprised if a good number of your website visitors don’t go straight into shopping behavior. Chances are, not all of your blog posts are meant to attract people ready to purchase right away.
But seeing the percentage of visitors that move on to each step can help you understand if your website is properly doing its job. If a lot of people are viewing product pages and going no further, maybe you need to work on conversion optimization for those pages.
Or if not many people are viewing your products at all, maybe you should redesign your website to drive more attention to your product offerings.
2. Checkout Behavior Report
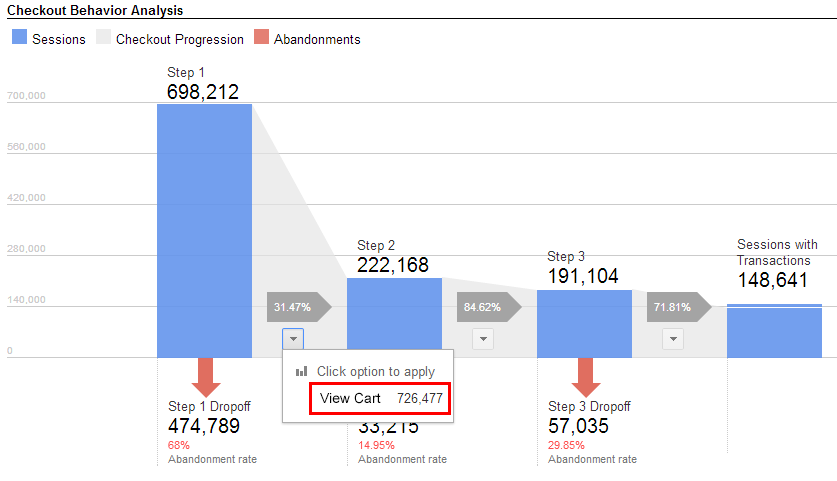
For more detail, you can hone in on the checkout behavior report and see at what point in the checkout process people drop off.

Is it on the page where they’re expected to put in their details, or on the review page right before they confirm? Is it when asked for payment info, or right when shipping costs are revealed?
Any visitor that begins the checkout process is someone that’s clearly interested in buying your products. If you’re losing them at that point, figuring out why is crucial. You may be able to regain some of these customers by adding more convenient payment options, like Paypal or Google Pay, or reducing how much customers pay for shipping.
3. Cart Abandonment Data
Cart abandonment tends to be more common than checkout abandonment, and is another important eCommerce metric to pay attention to. Any visitor that views a product and goes that extra step of adding it to their cart is interested. But adding an item to a cart is easy, checking out requires more work and commitment.
You can view cart abandonment data in both the Shopping Behavior Analysis and Checkout Behavior Analysis reports.
If you’re seeing a lot of cart abandonment on your site, you can consider a few strategic moves to address it. Automated emails reminding people to come back and finish the process can make a big difference. Working to simplify the checkout process, such as by asking past visitors if they want you to save their information for future purchase, can also help with this.
If you go look for this information in Google Analytics today, you may not see much. A lot of this data requires setting up Enhanced eCommerce tracking. Under Admin in Google Analytics, you can find eCommerce settings in the View column. Select On for Enhanced eCommerce Settings, then you can set up labels for each step in your website’s checkout process.
You can find detailed instructions for the setup process here.
Want to Learn More?
Google Analytics is a good starting point for understanding customer behavior on your website and identifying any user experience (UX) issues with how the purchasing process works now. But you can learn a lot more if you supplement the data with information that comes from humans.
Consider setting up customer interviews to ask them about their experience on your website and what thinking went into the decisions they made to buy (or not). And perform UX testing to stay on top of how well the different features and functionality on your website work, and spot any design issues that may be hurting how intuitive the site is.
Data can reveal what’s happening, but going straight to the source helps you better understand why.


![Yes, B2B Websites Can Use Personalization Too [Here’s How]](https://mdvirtue.com/wp-content/uploads/2022/02/Yes-B2B-Websites-Can-Use-Personalization-Too-Heres-How-400x250.jpeg)

0 Comments