

")
This article is part of Virtue Media’s Web Pros Series. In this series, we feature articles from our team of experts here at Virtue Media. Our Product Managers, Linux Administrators, Marketers, and Tech Support engineers share their best tips for getting the most of your website.
Let’s say you’ve got a great promo video on the homepage of your B2B website, which does an excellent job advertising your services and encouraging leads to call you. Only problem is, no one’s watching it.
Or maybe you run an eCommerce store. You have no problem getting people to visit from social media. Many of them even add items to their carts, but they’re still dropping off mid-checkout.
Sound familiar?
While frustrating, these are common experiences for any website owner. Fortunately, there’s a way to discover what’s keeping people from converting on your website.
All you’ll need to figure it out is a free Google Analytics account and a solid internet connection. (If you haven’t set up Google Analytics for your website yet, you can do that here.)
Then, it’s time to set up sales funnels in Google Analytics. Once that’s done, you’ll be able to track visitor behavior on your website, identify problem areas, and optimize the user experience to get more visitors to do more of the things you want—like make a purchase, fill out a lead form, or subscribe to your newsletter.
If any of that sounds confusing, don’t worry. Below, I walk you through what sales funnels are, why they’re important, and how to track them in Google Analytics. We’ll end by discussing how you can take action based on the insights they provide.
What Is a Sales Funnel?
A sales funnel is a sequence of steps that a user takes for completing a conversion. A sales funnel on an eCommerce website might look something like this:
- The customer arrives at the website.
- Once there, the customer browses a few different product pages.
- Next, the customer adds an item or two to their cart.
- Finally, the customer purchases said item(s).
The sales funnel looks different for different types of websites and different types of customers. That’s why it’s important to know who your customers are and outline the series of actions they might take on your website.
All sales funnels end in a conversion. A conversion can have different definitions depending on what business you’re in and the type of website you’re operating. Traditionally, when people think of a conversion, they think of completing an order on a website. But a conversion can be broader than that, like signing up for your email newsletter or downloading a whitepaper.
Ultimately, a conversion is any behavior you want your customer to take that results in some value for your business.
Why Every Site Owner Should Care About Sales Funnels
Sales funnels are essential for understanding the steps your customers take before reaching their final conversion, and any obstacles that prevent them from getting there.
You can think of each step in your sales funnel as a pivotal touchpoint you want people to reach on their way to converting. Once you’ve defined each of those steps, you can identify the areas of friction: the places where people get stuck, leave, or otherwise don’t continue with the conversion process. When you have that information, you’re able to optimize the design and flow of your site, adjusting things to capture more conversions. Suddenly, you know what’s working on your website, and what’s not—so you can get started fixing it.
Case in Point: Business Coach Example
Here’s an example to illustrate the value of sales funnels. Let’s say you’re a business coach. As part of your lead gen process, you offer a free 30-minute consultation, so clients can get a feel for what it’s like to work with you. You advertise this consultation throughout your website with a prominent CTA button. To sign up, people have to click to a separate registration page and complete a form.
By analyzing your sales funnel in Google Analytics, you find that these CTA buttons have a high click-through rate. Regardless of which page they clicked from, the number of people who see the CTA button, compared with those who click on it to reach the registration page, hovers around 50%. That indicates that you’re doing a great job creating interest in your free consultation.
However, once people reach the page with the registration form, fewer than 1% actually fill it out. Given that interest was so high, what explains this sudden loss of interest? Your consultation is free. What do people have to lose?
Well, your registration form might have too many fields, exhausting people from filling it out in the first place. Or, the actual signup form is buried way down on the page where people can’t find it. Maybe the page loads slowly and people give up and leave.
Each of these could be opportunities to improve your sales funnel. Currently, one or more of these things is turning people off and making them leave. Once they’re gone, they might as well be gone forever. It’s up to you to test different changes to see what boosts that 1%.
Thanks to Google Analytics, you know exactly where the problem lies: the page with the form. People are clicking through to the page with the form, but they’re stopping there. The sales funnel helps you pinpoint the issue, so you can stay focused and make the changes that drive improvements—instead of wasting your time working on things that aren’t part of the problem, like changing up your advertising copy, or bumping up the consultation time from 30 minutes to 60.
What Is Funnel Analysis?
Funnel analysis is turning your sales funnel into something you can monitor and analyze. Let’s use an eCommerce site as a hypothetical.
Below would be potential steps in your funnel:
- People arrive on your website.
- People navigate to a product page.
- People add a product to their cart.
- People make it to the checkout page.
- People actually complete their purchase.
Funnel analysis involves quantifying each of those steps and seeing how many people made it to each. Essentially, you want to know two things: the percentage drop off from step to step, and the cumulative percentage of the total. This gives you really good visibility of where your friction points are.
Plug those steps into Google Analytics, and you can literally see the friction points. For our hypothetical eCommerce site, here’s what the data might look like in Google Analytics:
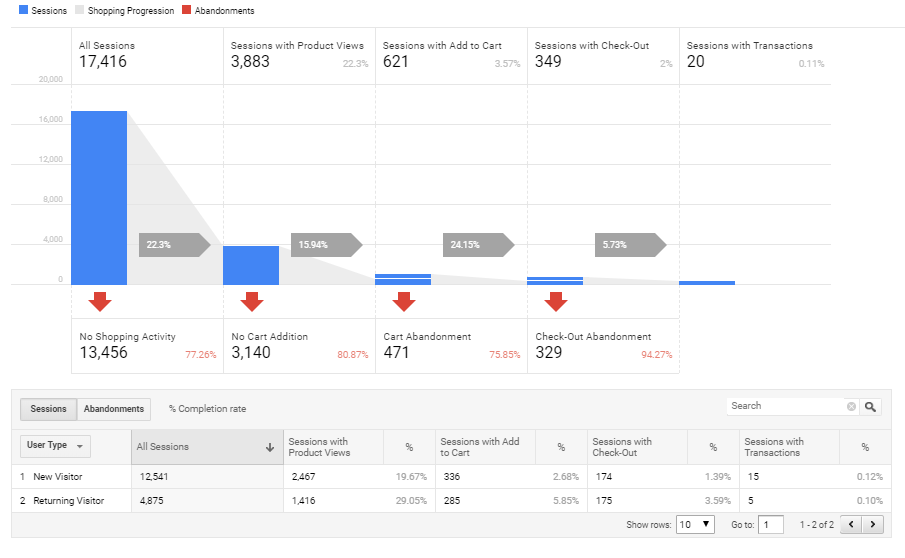
The blue blocks represent the total number of people who reach each step, while the red arrows point to the number of people who drop off at each step. This data tells us a few things:
- Of all the people who reach the website, 80% leave without browsing any product pages. That represents a big opportunity for us. We might look into whether the homepage does a good job directing people towards product pages? Are product categories listed in the main menu? Are featured items highlighted on the front page? These are all the things we could test to drive more people to visit the product pages.
- Of the people who visit a product page, 75% of them end up progressing to the next step, and adding the item to their cart. Nice! This is a good sign that among the people who are interested enough to visit the product page, we do a great job convincing them they should buy it.
- Unfortunately, only about 6% of those people end up completing their checkout. So, something is off. Maybe there’s a technical issue with the checkout page, and people don’t feel like they can trust the site with their credit card information. Maybe there are too many fields for them to fill out, or it asks for information unrelated to their purchase. Whatever the reason, this is an issue worth looking into. The fact that people added the item to their cart indicates a strong intent to buy, so if none of them actually convert, there must be something blocking them from making a successful purchase.
Just by looking at the raw data, we suddenly have a ton of information we can work from to optimize our website. This is what makes funnel analysis so relatable. Once you start to think of your website as a journey for your customers to take, you can get in their mindset and consider the incremental steps that keep them moving forward.
Next, let’s talk about how to apply this strategy to your site.
How to Visualize the Sales Funnels for Your Website
Before you even open Google Analytics, step one is to get a good understanding of your site and what you want people to do. I recommend a brainstorming session where you map out your funnels. If you have an eCommerce site, your funnels likely look similar to the ones we outlined above.
If you have a blog, the funnel concept still applies. There may be no product pages or “add to cart” button, but you still have a homepage, category pages, and blog articles. These blog articles are essentially the “products” of your site.
You want to sit down and really think about your site, the journey you want people to take, and their ultimate destination or goal. Is that goal having them read the blog? Figuring out how to direct them toward your blog articles would be the top priority.
Remember, you could have multiple funnels within one site. You may be a blogger who sells products on the side, so you’d have different sales funnels for your blog content vs. your online store.
By the end of this brainstorming session, you should know what you want people to do, and have that broken out into steps (e.g. entering the site, visiting a blog page, downloading a whitepaper).
How to Set Up Sales Funnels in Google Analytics
Once you have your sales funnels mapped out, it’s time to collect the data. There are a lot of ways to skin the cat but segments and goals are easiest, so that’s what I’m going to show you today.
We’ll start with the easiest option: creating a segment.
Note: For the sake of expediency, we’re going to use product pages as an example in the following steps. If you’re setting up funnels for your blog, adjust accordingly.
Option #1: Create a Segment
You’re going to create four segments: one each for your home, product, cart, and thank your page. In Google Analytics, navigate to Acquisition > All Traffic > Channels. This screen shows you all your website traffic, broken down by channel (social, organic, direct, etc.).
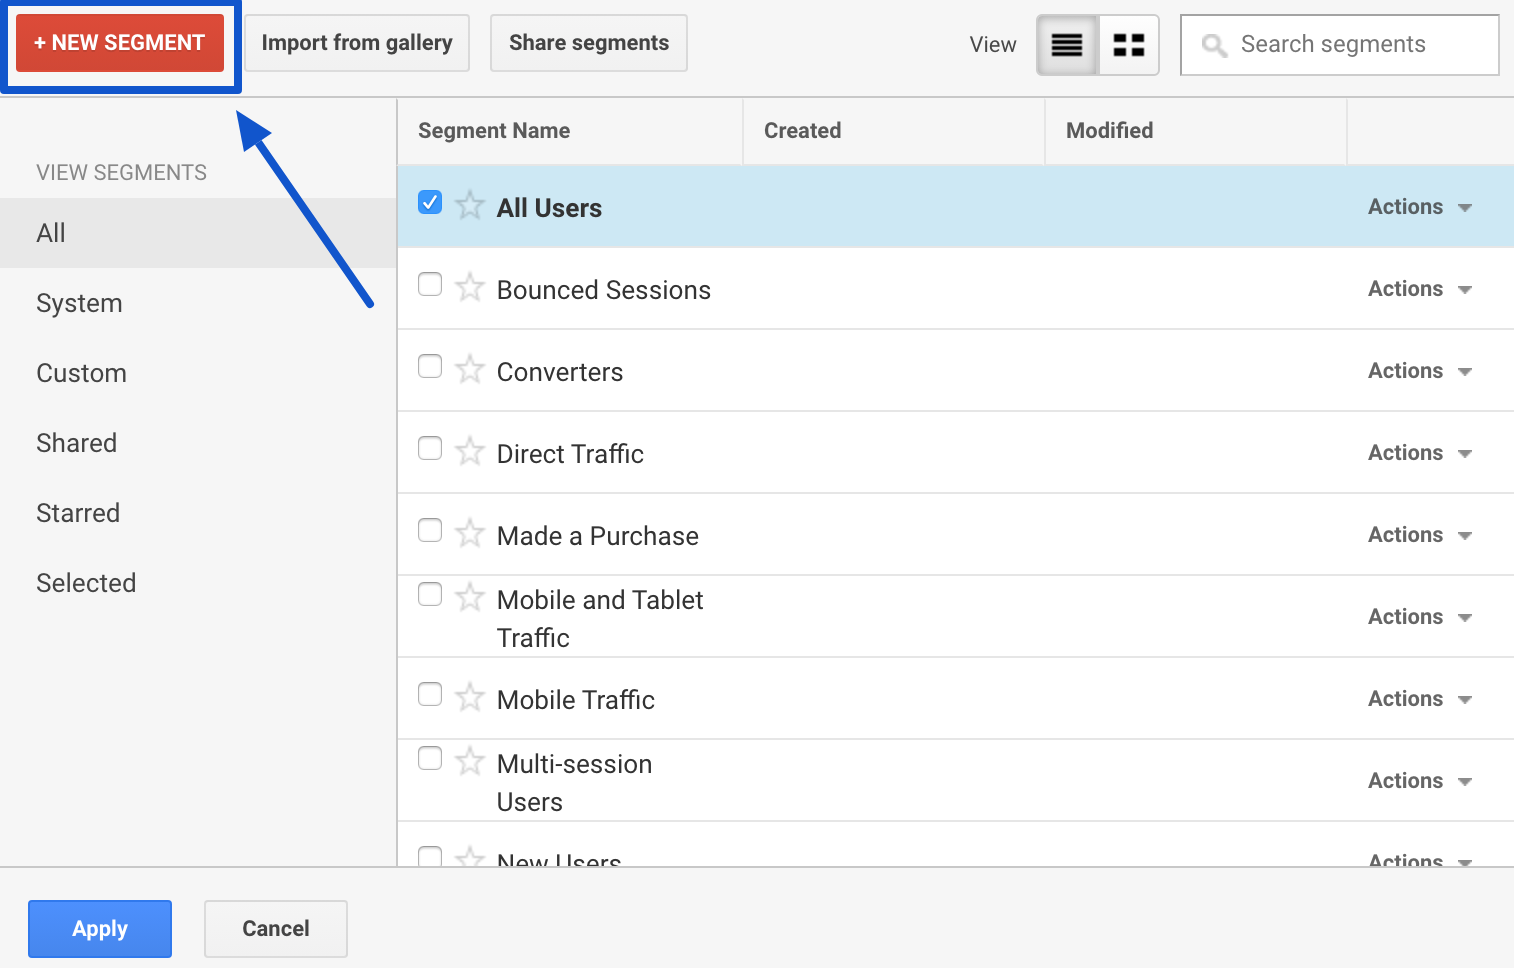
Step 1: Create your homepage segment. Click the Add Segment button at the top left.

This will take you to a new screen. Here you’ll see that Google Analytics already offers a lot of options relevant to sales funnels. If you wanted to, you could click “Made a Purchase” and call it a day.
But your site isn’t one-size-fits-all. You’ve already outlined the specific pages on our site that you want users to progress through. The easiest way to create a segment for that specific sales funnel, and avoid Google muddying up the data, is to create a custom segment. Click the red New Segment button in the upper left.
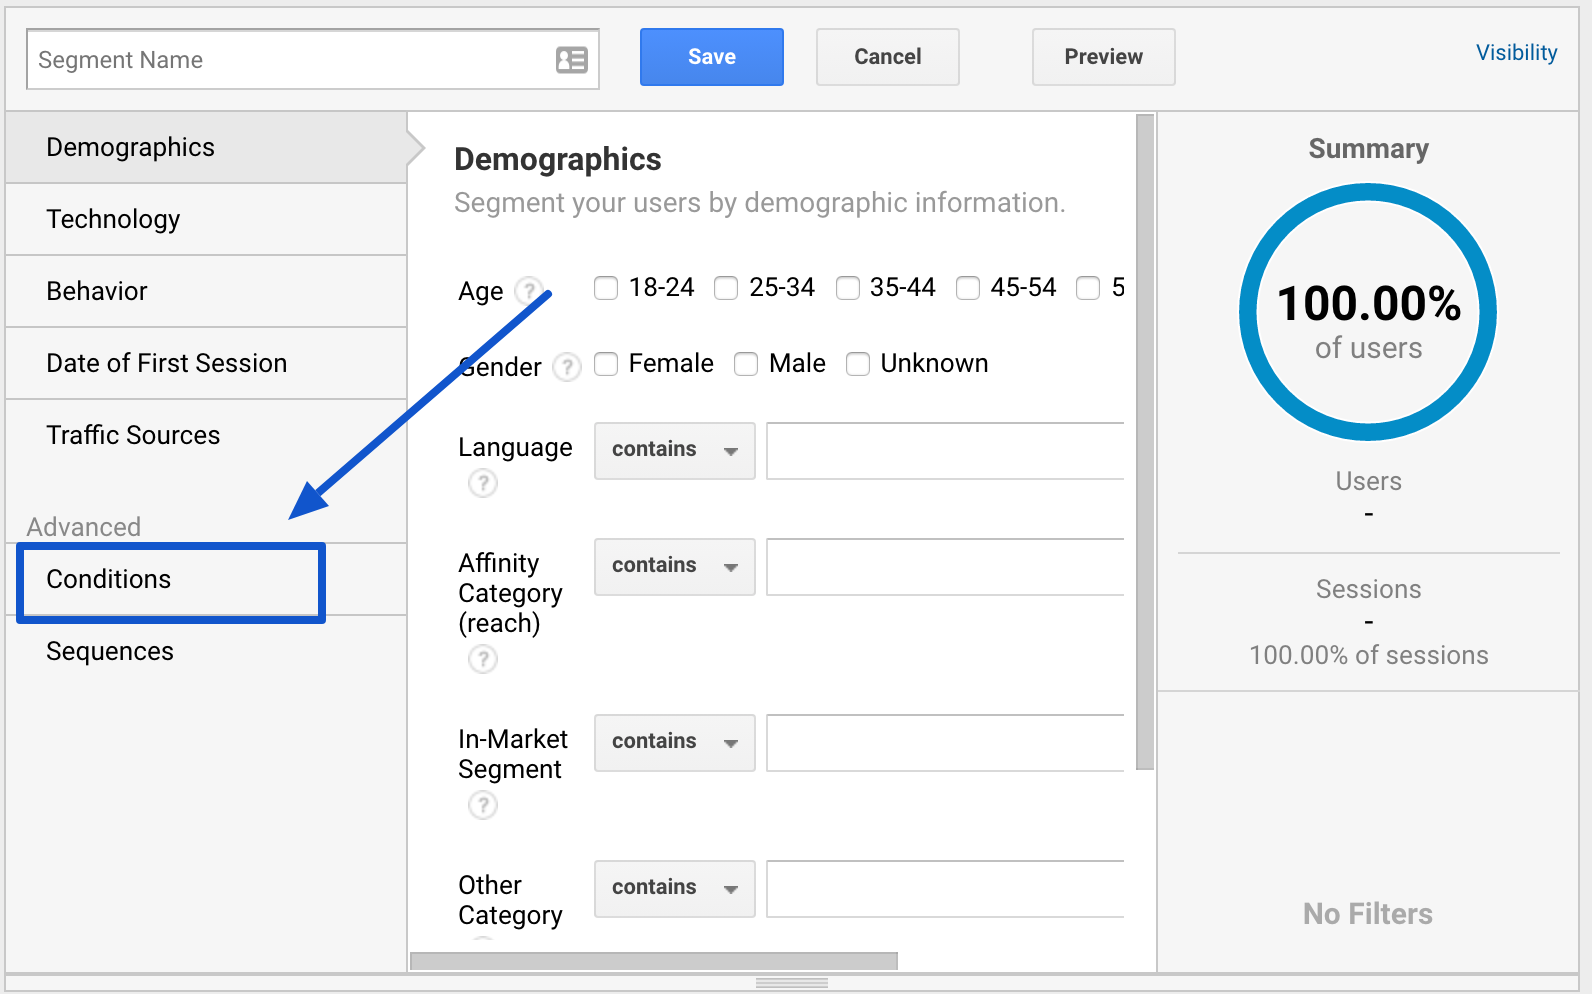
Next, click Conditions under the Advanced menu on the left.
In this screen, you’ll define each step of our sales funnel. Using the drop down menu, search for and select “Page.”
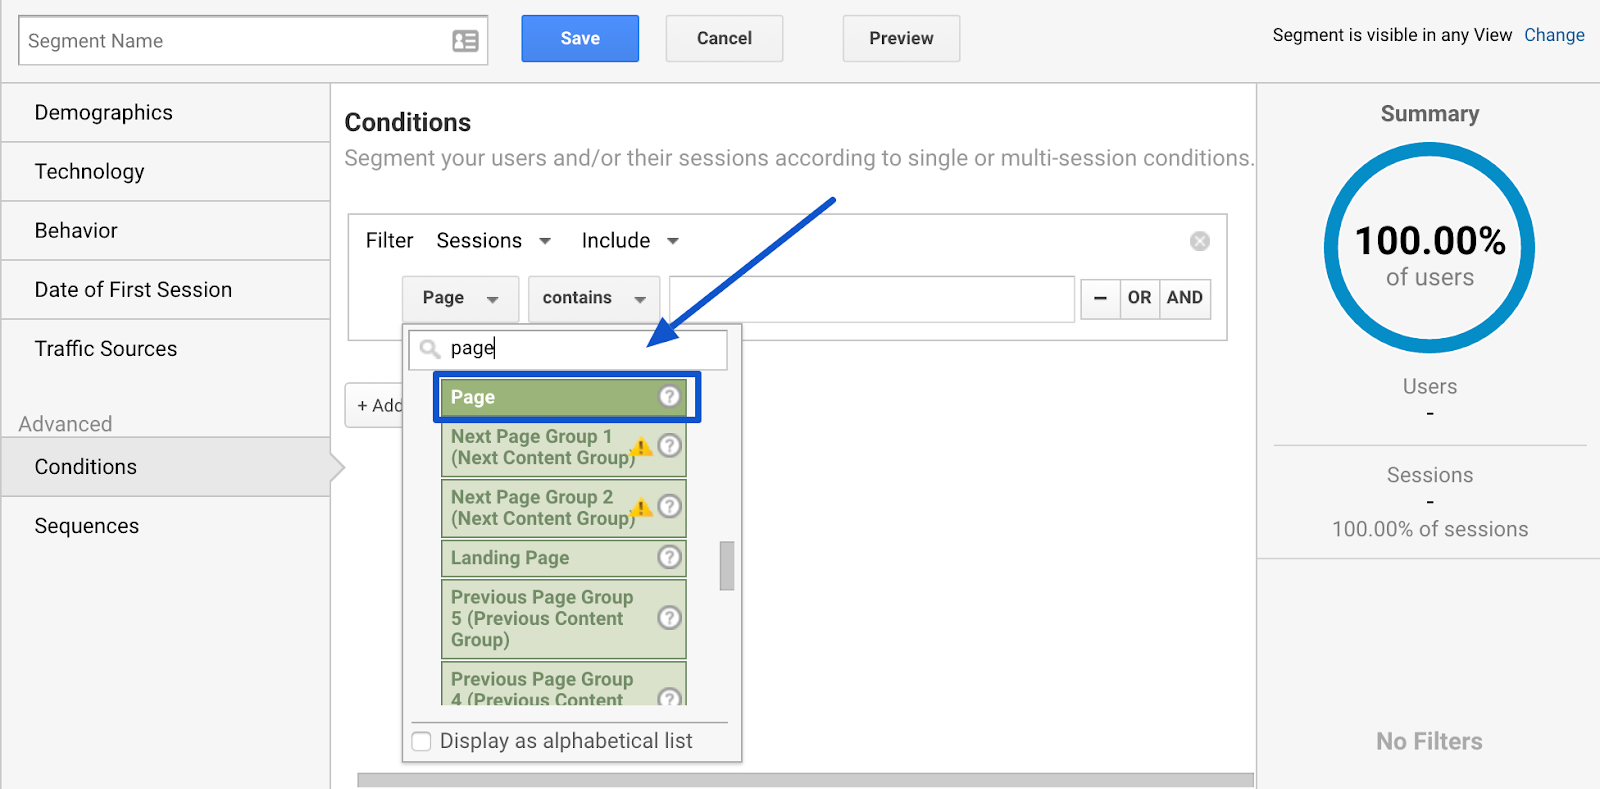
Then, select “exactly matches” from the second drop-down menu. This prevents Google from including other pages with similar URLs.
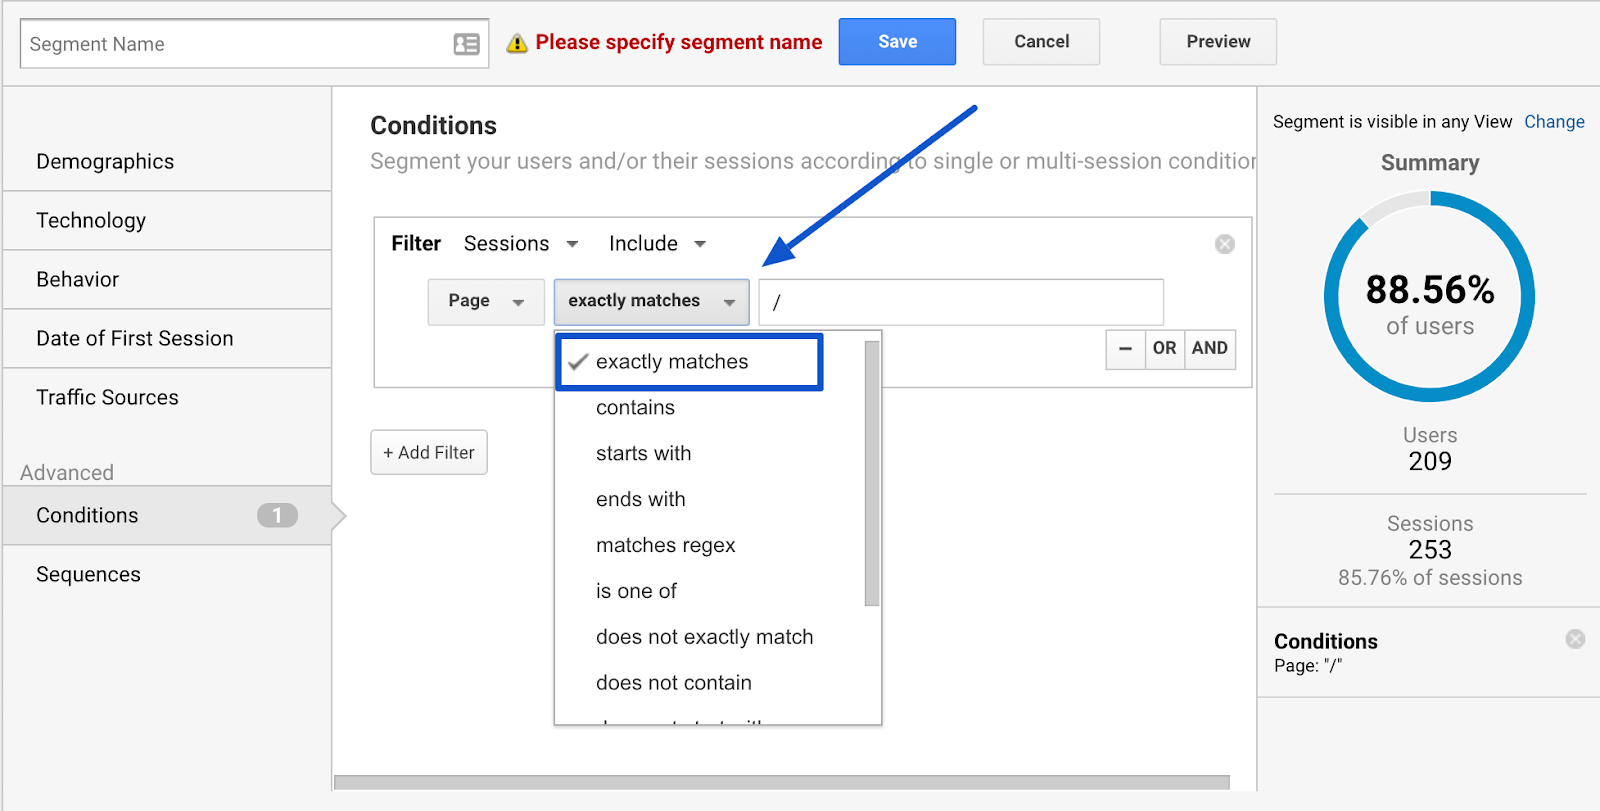
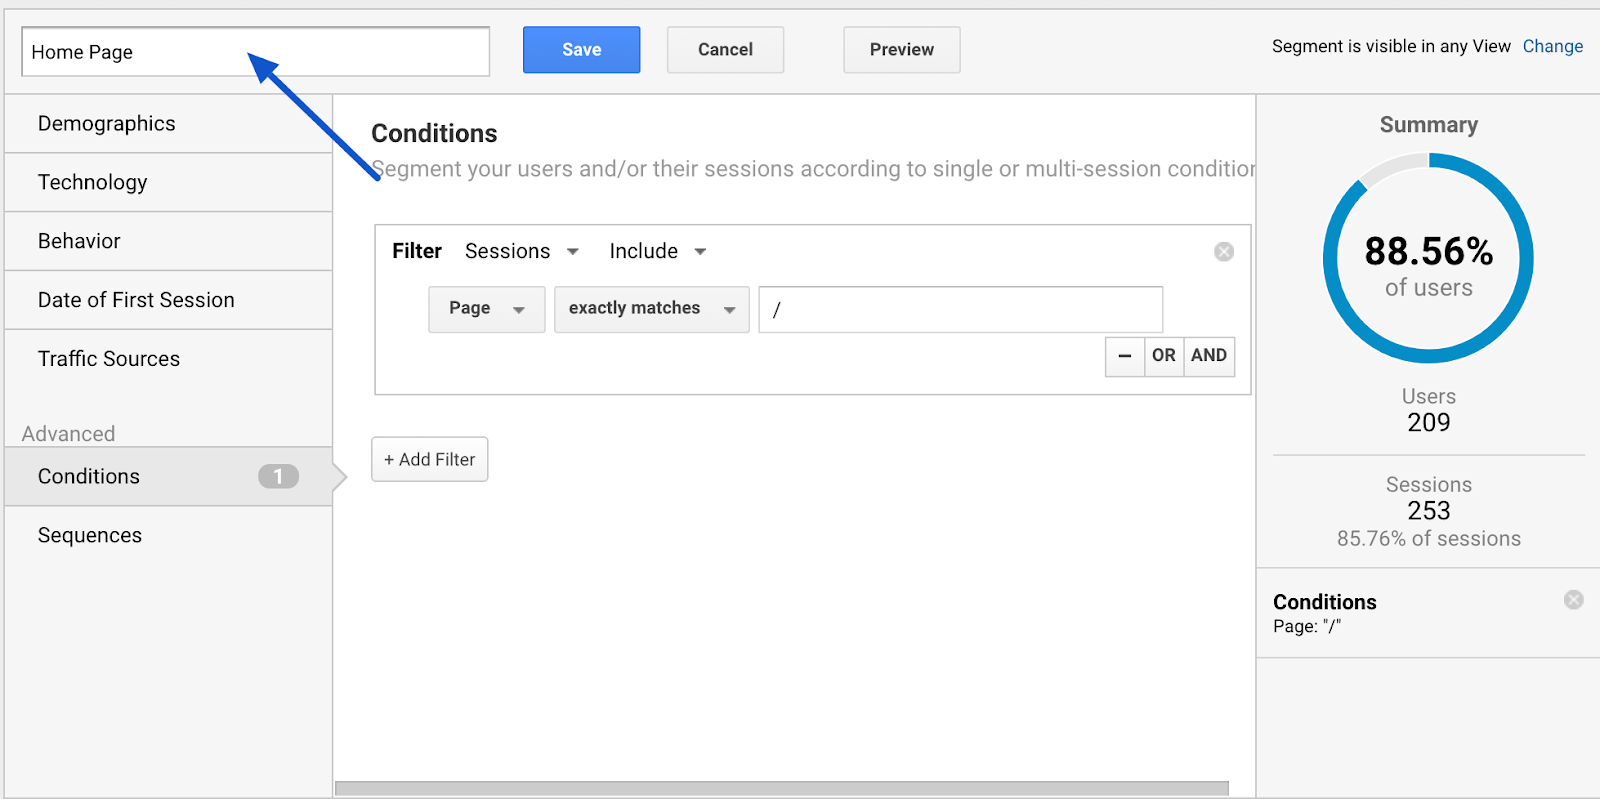
Finally, either enter the URL of your homepage in the text field, or use the / suggested by Google. (In Google Analytics, / is shorthand for your homepage.) Name your segment in the “Segment Name” field at the top left, and click the blue Save button.
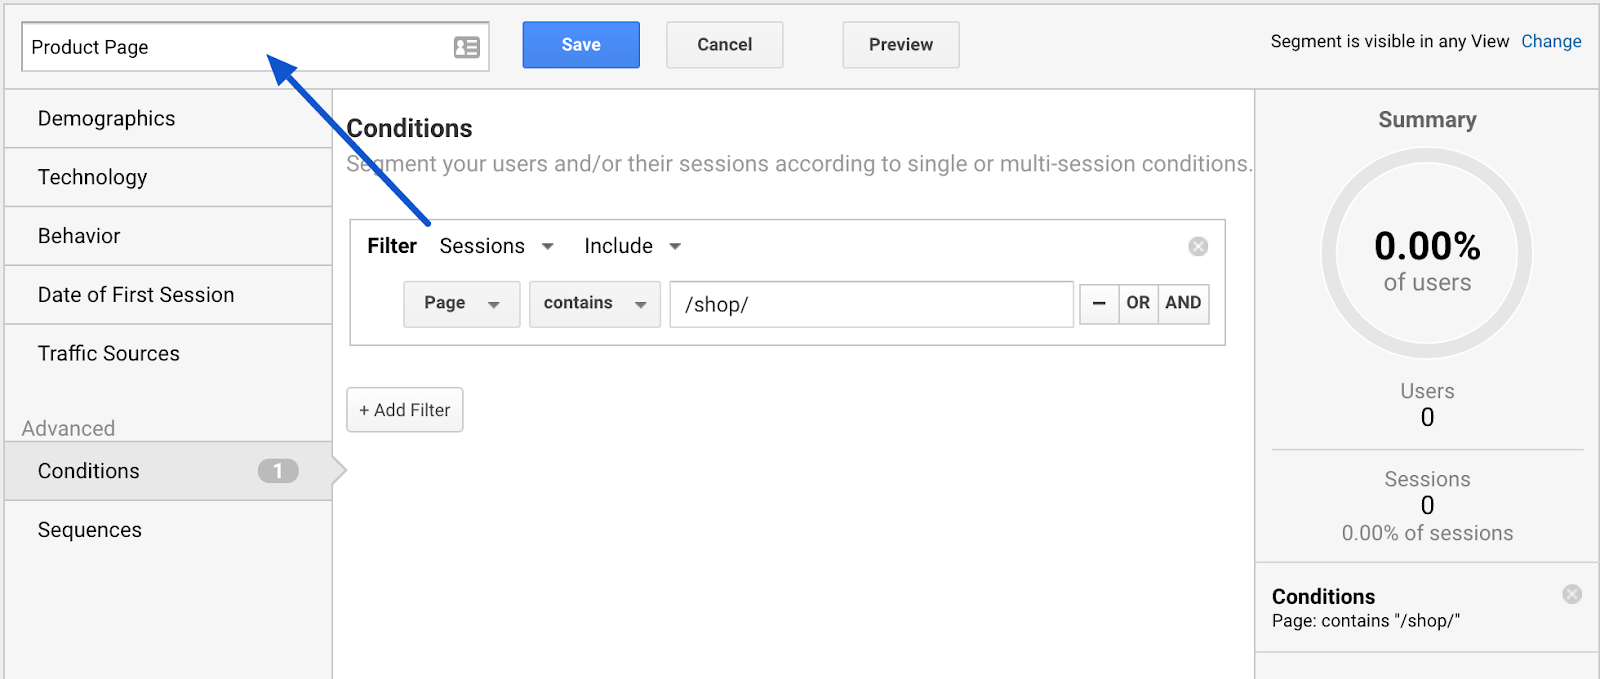
Step 2: Create your product page segment. To see how many people go from your homepage to the product page, you’ll need to create another segment. To do that, you’ll repeat the same steps above. Here they are for easy reference:
- Click on Add Segment.
- Click the red New Segment button.
- Click Conditions under the advanced menu on the left.
- Search for Page from the drop-down menu.
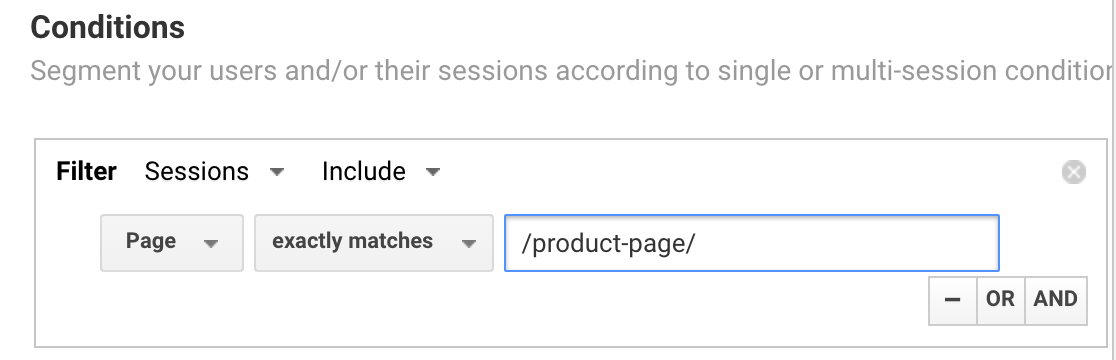
Next, if you have a single product, or you want to create a funnel for just one product, you can continue the same process you used for your homepage. Select “exactly matches” from the drop-down menu and enter the exact URL of the product page in the text field.
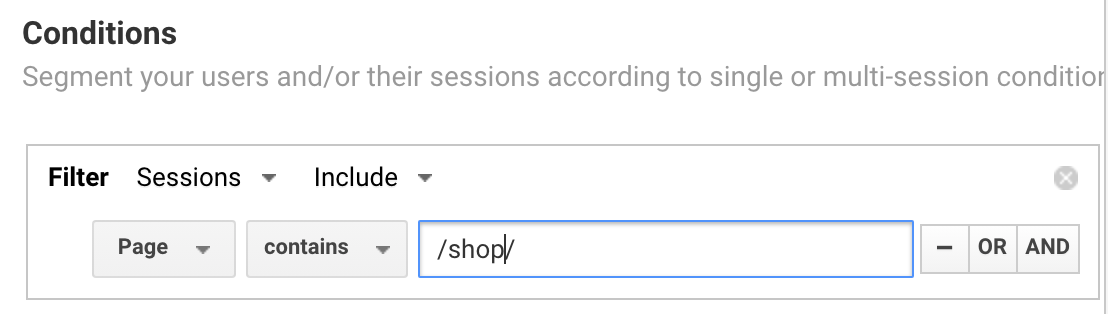
Alternately, if you sell multiple products, you might want to see how many people visit any product page on your site. In that case, you select “contains” instead of “exactly matches” from the drop-down menu, and use a common denominator in the text field (for example, if all your product pages include /shop/ in the URL, you would enter /shop/ in the text field.)
Give your segment a name you can identify, like the product name, or simply “Product Page,” and click Save.
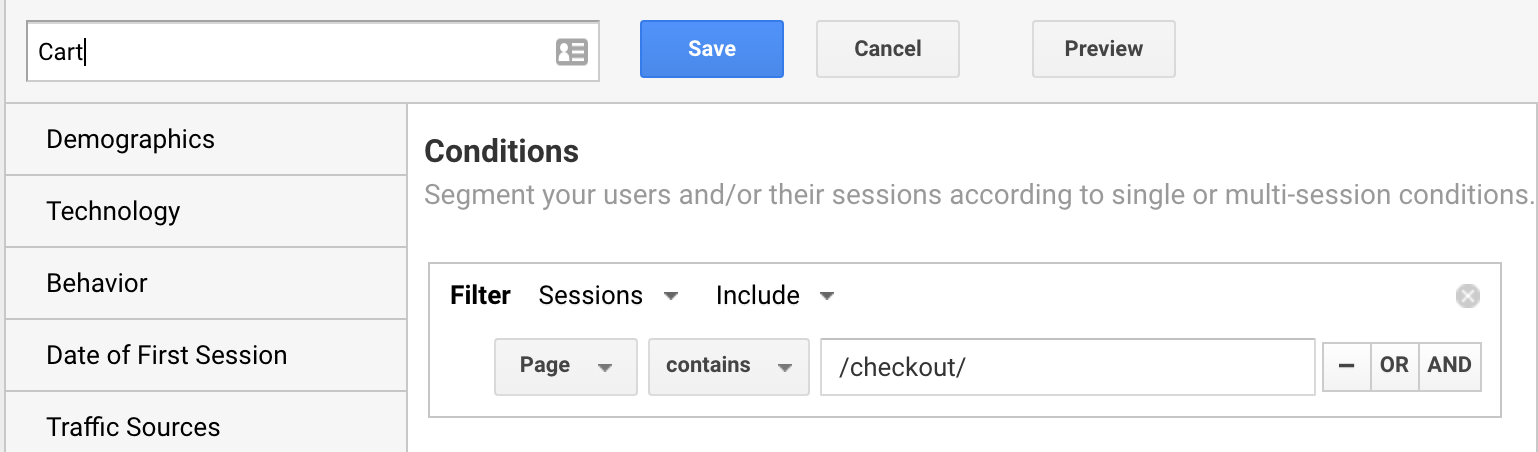
Step 3: Create your cart page segment. Follow the same steps again:
- Click on Add Segment.
- Click the red New Segment button.
- Click Conditions under the advanced menu on the left.
- Search for Page from the drop-down menu.
For your cart segment, you’ll likely need to use the “contains” option, since the URL may change for each individual cart. Find a common denominator like /checkout/ or /cart/ and enter that into the text field.
Name your segment “Cart” or something easily identifiable, and click Save.
You can probably guess what’s coming next.
Step 4: Finally, create your purchase confirmation, or thank you, page segment. Follow the same steps again:
- Click on Add Segment.
- Click the red New Segment button.
- Click Conditions under the advanced menu on the left.
- Search for Page from the drop-down menu.
Again, since the specific URL may vary by user, you’ll want to use the “contains” option and find a common denominator in the URL, like /thank-you/. Name this your “Thank You” segment and click Save.
Now, your Google Analytics should look something like this:
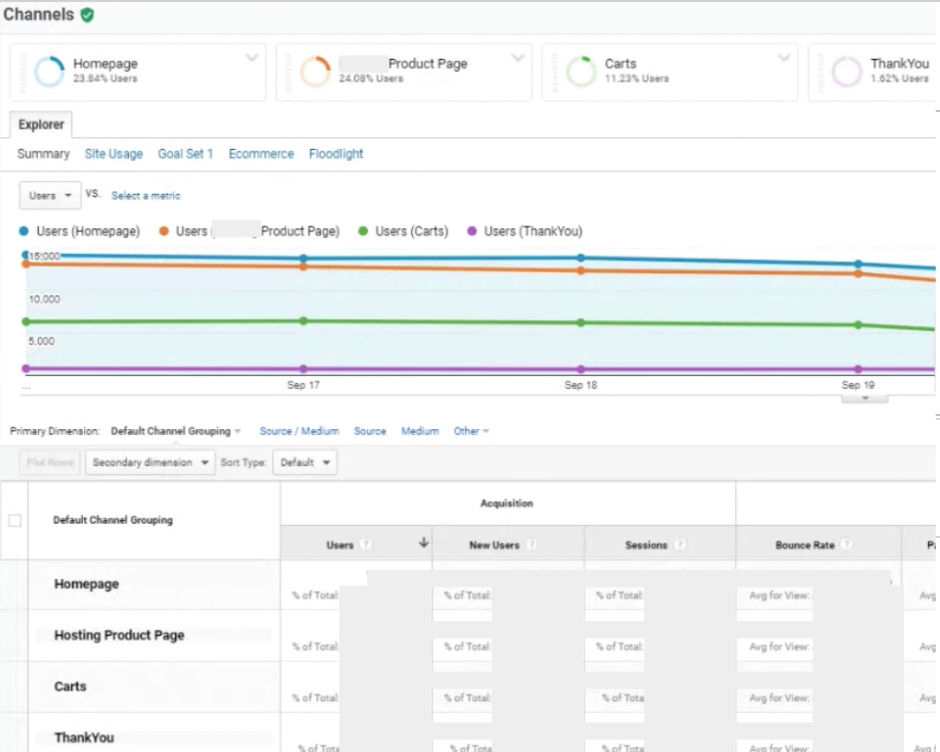
Each segment is represented by a different-colored line, and you can visually see the drop-off from step to step. There’s also a wealth of numerical data for each segment outlined below. In this sample, it looks like there’s a significant drop-off from the product page to the cart, and again a number of people who don’t complete checkout. Either of these would be good places to start optimizing.
Option #2: Get Up Goals in Google Analytics
Now, for the slightly more advanced option: setting up Goals.
Once you do this, you’ll unlock additional Google Analytics capability, like the Funnel Visualization report (available under Conversions > Goals > Funnel Visualization).
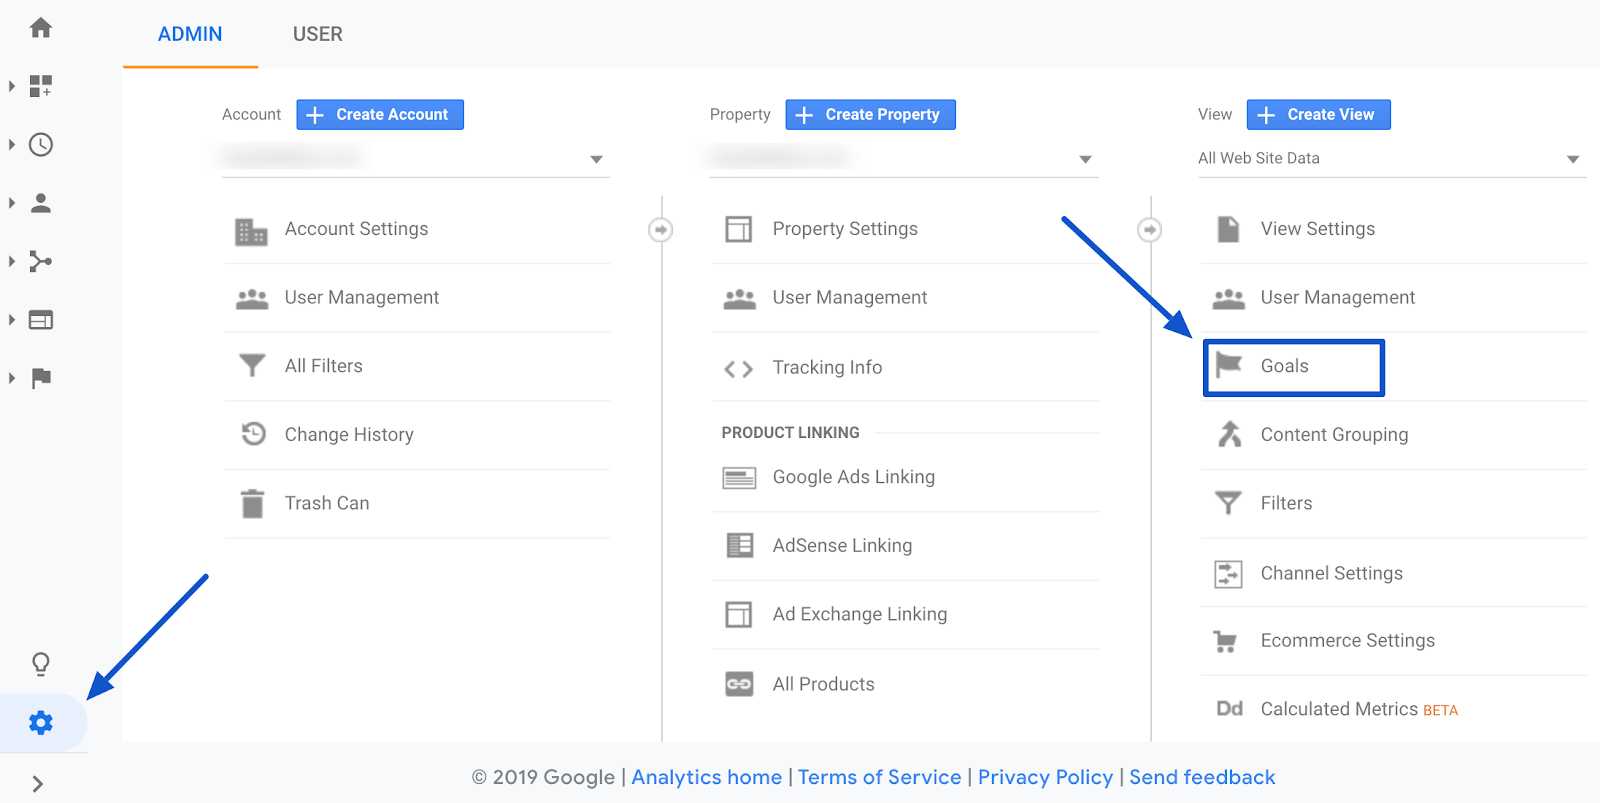
To set up goals, you’ll need to go to your Google Analytics Admin settings. Click on the gear icon in the bottom left corner of your screen, then click Goals.
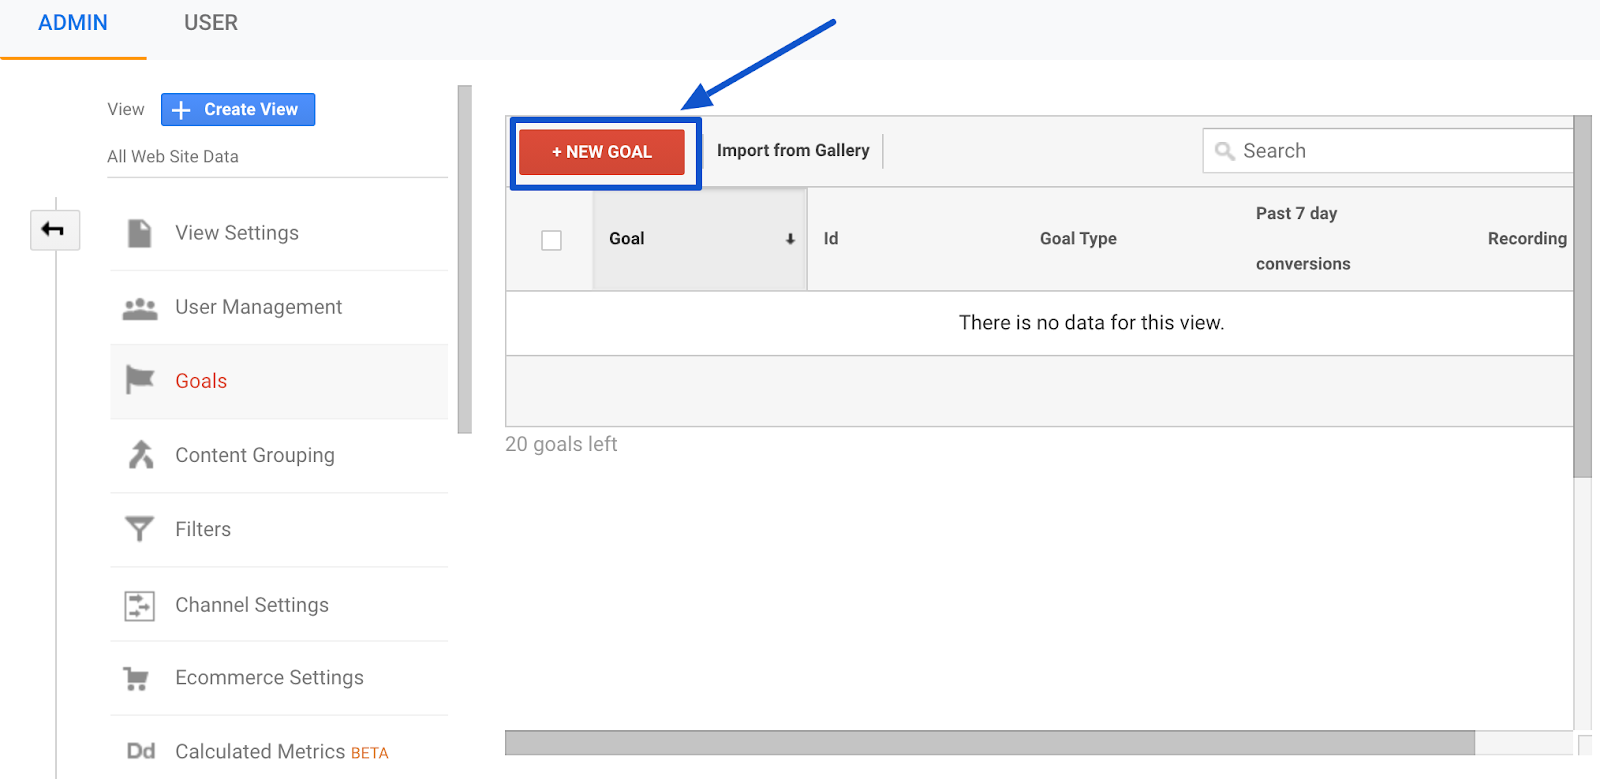
Next, click the red New Goal button.
We’re going to use a Template goal here to track completed orders. Check the circle by Template, then click the blue Continue button.
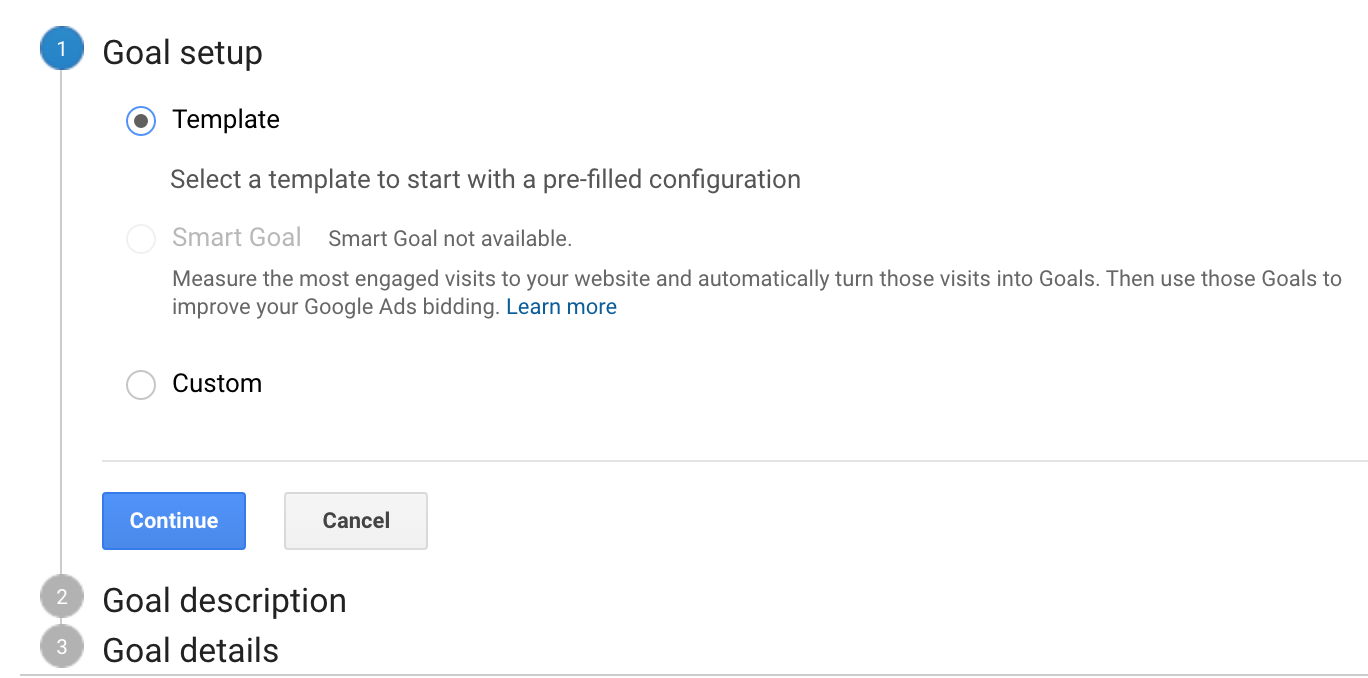
As with segments, you’ll find there are a bunch of template goals you can choose from, based on common conversion goals people have for their websites. For example, if we hosted product videos on our site, we might want to track how many people actually watch themt. The Event goal would be useful for that. Since we want to track how many people ultimately place an order, we’ll stick with Destination.
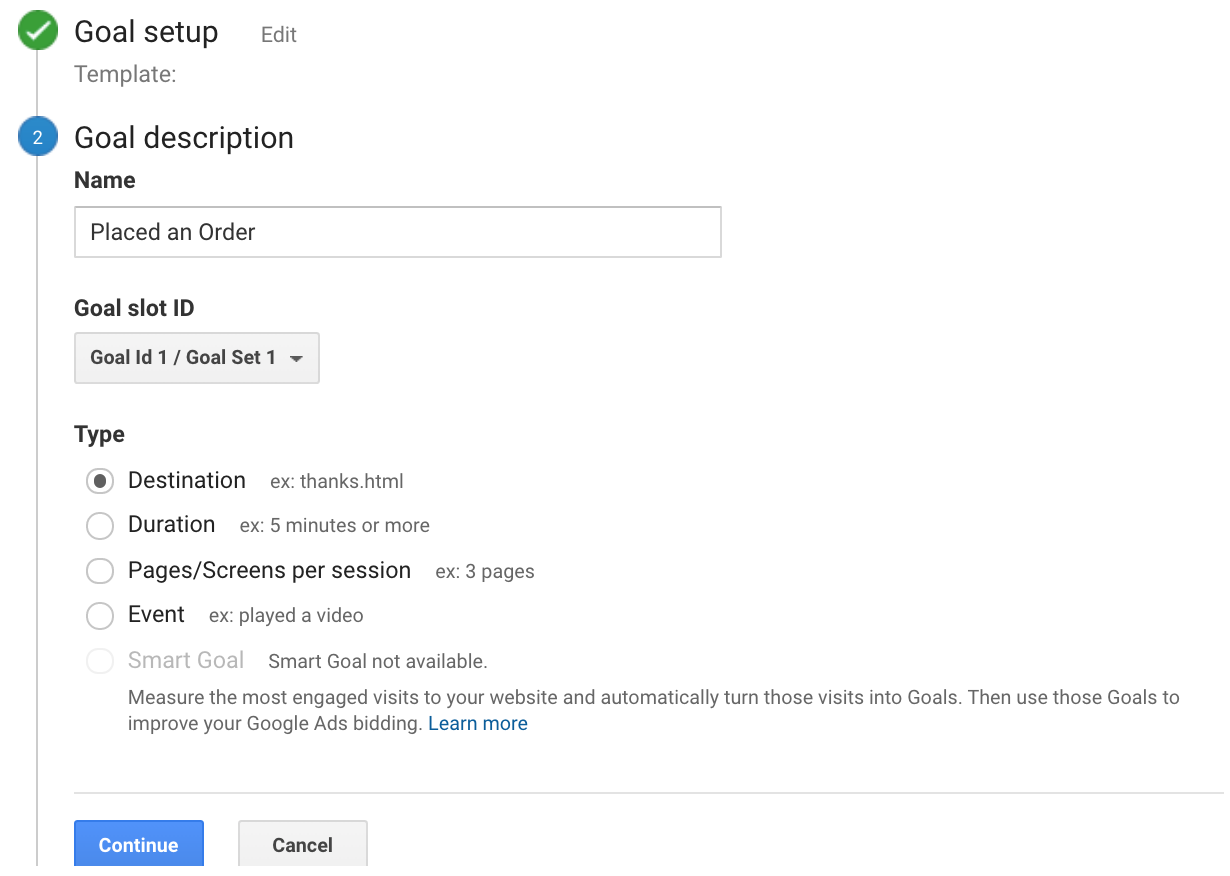
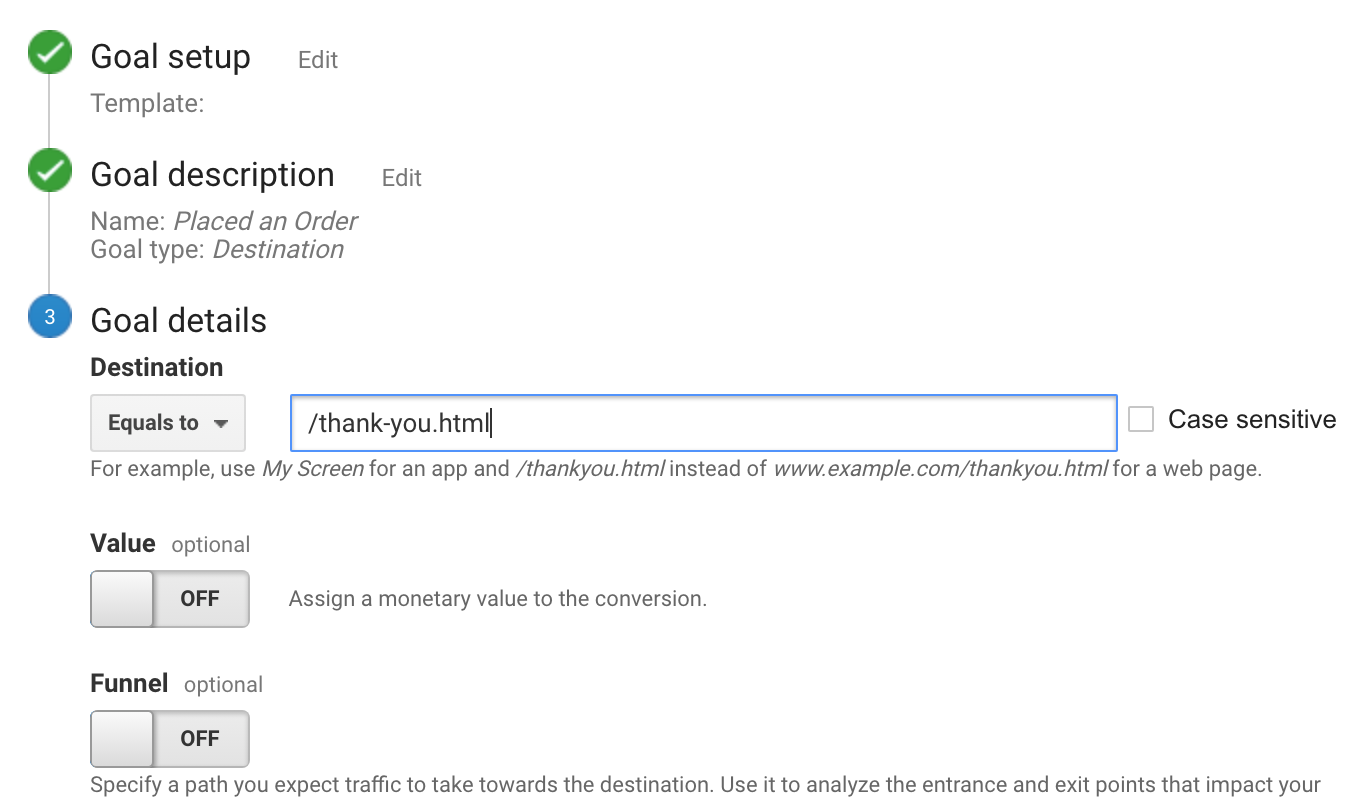
Enter a name for your goal, like “Placed an Order, “ and check the circle by Destination. Then click Continue.
In the final screen, we’ll use our thank you page as the URL and selects “Equals to” from the drop-down menu:
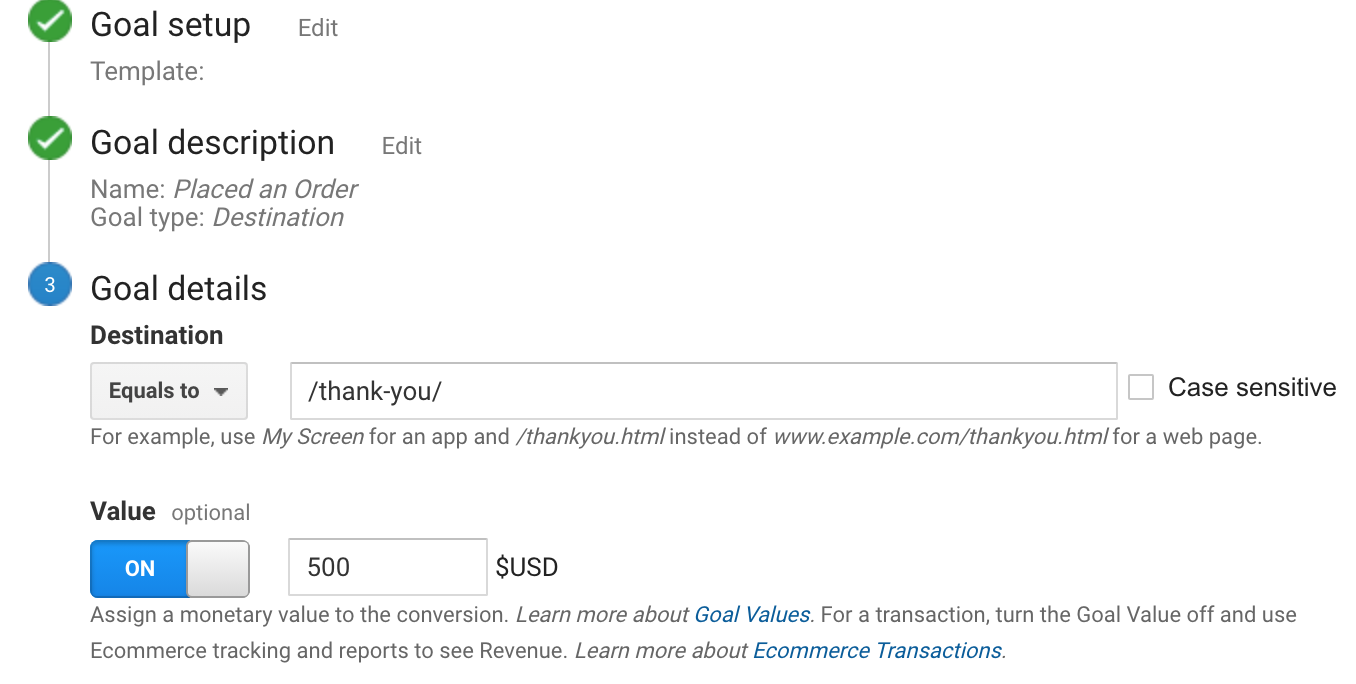
Now, you have the option of setting a Value for each conversion. If you primarily use your website for lead generation, your revenue likely isn’t captured through Google Analytics. You can still estimate it by turning the Value field to ON, and then specifying a dollar amount. For example, if you’re using this goal to track whitepaper downloads, you might guess that on average each download is worth $100 to your business, so you would enter that. Again, this field is optional.
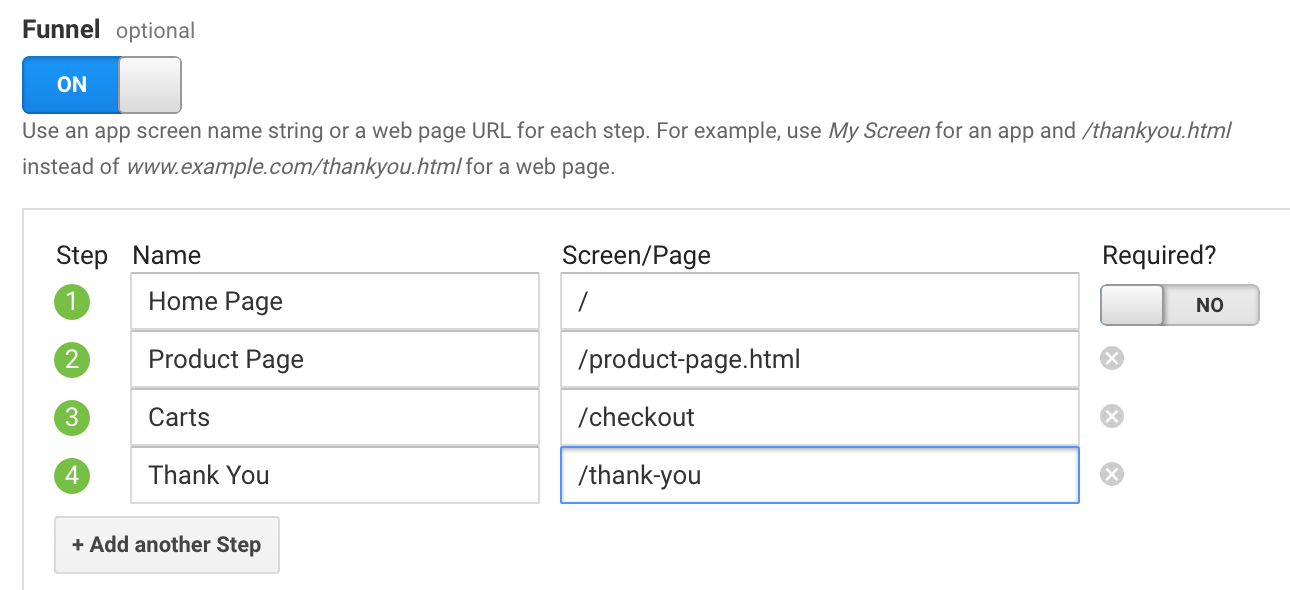
Next, turn Funnel to ON. Here, you’ll outline the different URLs for each step of your funnel, like we did when we created custom segments. Click Save when you’re done.
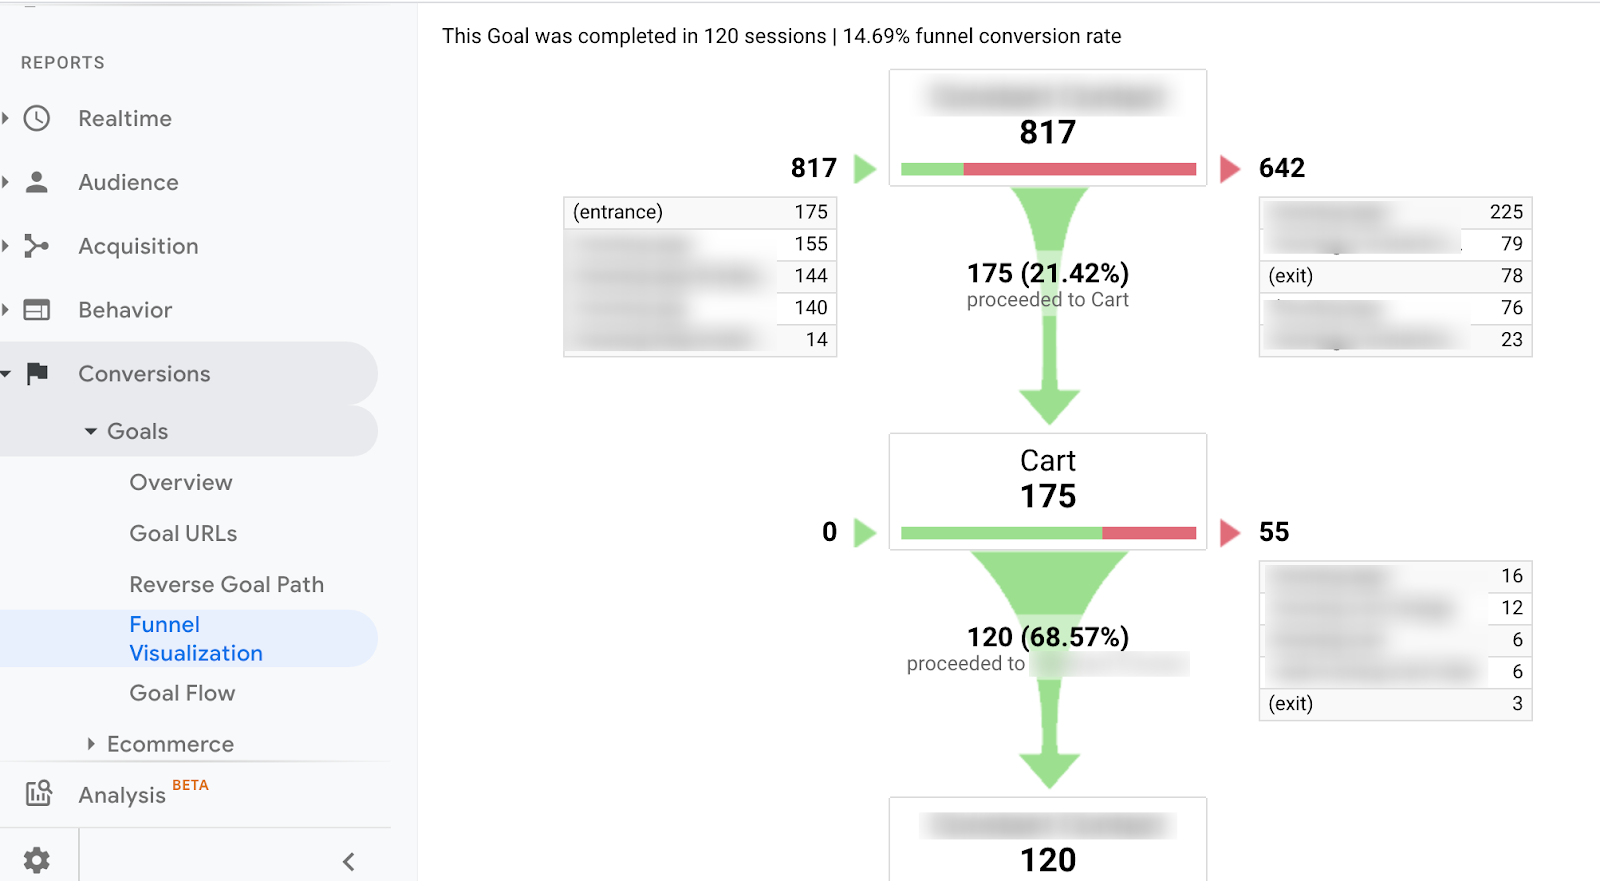
Finally, click “Verify this goal” to check your work. Then, navigate back to Conversions > Goals and you’ll see you can now view the Funnel Visualization report where it shows you a visual representation of your funnel:
This report tells us a few things at a high level:
- At the top, it tells you how many people completed the goal (120 sessions) and the all-up conversion rate for this funnel (14.69%).
- On the left, it tells us the prior page that brought visitors to funnel in the first place. Often, this tends to be the homepage. That’s the most popular page for most websites, so it makes sense that it shows up here (indicated by “(entrance)”).
- On the right, it tells us how many people abandoned the funnel at each step, and what page they visited next, if they didn’t leave your site completely (indicated by “(exit)”).
Google Analytics will show you this same information for every step. Where did your visitors come from before entering your funnel, did they leave at any step, and if so, where did they go?
How to Use Google Analytics Funnel Data to Optimize Your Site
Funnel analysis helps you quantify how many users make it to each step, and determine the abandonment vs. retention rate for each step. Funnel analysis gives you the what. The why is a bit harder to decipher.
Again, let’s use our eCommerce funnel as an example.
Our funnel analysis reveals we have a high percentage of people going from our homepage to our product page. That’s great. If people didn’t make it there, that’d be roadblock #1.
But of those people that reach the product page, a large number drop out before adding anything to their cart. We’d want to focus here first. What can we do to improve our product pages?
- Is it a design issue? Are users confused by how to add a product to the cart? We might need to tweak the placement, color, or size of the Add to Cart button.
- Is it a marketing issue? Maybe our positioning needs work and we need to do a better job emphasizing the benefits of this particular product.
- Is it a pricing issue? Perhaps the pricing is really high compared to our competitors. When people see it, they gawk at it and leave.
There are all sorts of reasons you might see friction at the funnel steps. That’s when this quantitative data works really well with the qualitative side, like adjusting the user experience, surveying your customers, and A/B testing your changes.
Customer surveys are my favorite place to start. There are lots of great (and free) survey tools you can use for this. Run a survey on the problem page with one simple question: “Were you able to accomplish what you were looking for on the site? If not, why not?”
From my experience with usability testing, you’ll find lots of people say they can’t find something or don’t know where to go in the survey. This is a big opportunity to work on first.
If you have a small budget, start with your friends and family. Ask them to walk through the process of buying them on your website, but don’t give them any hints. Do they run into any roadblocks?
Turning Insights Into Action with Sales Funnels in Google Analytics
Conceptually, sales funnels are not a very challenging thing to grasp. We’re all consumers and we’re familiar with conducting business online. We’ve all been in that position before where we find ourselves so confused by a website, that we get frustrated and leave for a competitor site.
That confusion represents a choking point in your sales funnel, and it can make or break your site. Funnel analysis helps you find those choke points. Then, it’s up to you to experiment with how to fix them.
Fortunately, setting up sales funnels in Google Analytics is not difficult. Follow the steps above, and you might be surprised by what you find!Ready to do more with Google Analytics? Check out our guide to filtering out bot traffic.


![Yes, B2B Websites Can Use Personalization Too [Here’s How]](https://mdvirtue.com/wp-content/uploads/2022/02/Yes-B2B-Websites-Can-Use-Personalization-Too-Heres-How-400x250.jpeg)

0 Comments